
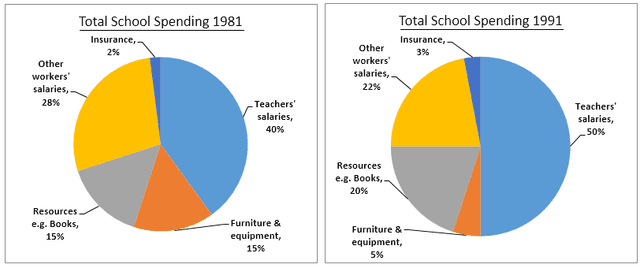
The given pie charts provide data about the distribution of school funds in the UK over the period of 20 years from 1981 to 2001.
Evidently, a majority of total money was allocated to the salaries of teachers throughout,
while
insurance accounted for the lowest proportion with a constant rise during these years Linking Words
in contrast
to other worker's Linking Words
wage
that declined constantly.
As far as the salary of teachers is concerned, 40 Fix the agreement mistake
wages
Use synonyms
percent
of Change the spelling
per cent
total
was spent in 1981, which Add an article
the total
has been
increased a decade later, compromising half of the total, Wrong verb form
was
then
fell by 5 Linking Words
Use synonyms
percent
in the Change the spelling
per cent
last
decade. Linking Words
Similarly
, the fund Linking Words
was
distributed for Unnecessary verb
apply
the
resources like Correct article usage
apply
book
experienced a Fix the agreement mistake
books
zig zag
trend, accounting for 15 of every 100, 20 and 9 Add a hyphen
zig-zag
Use synonyms
percent
in order of years.
With 2 Change the spelling
per cent
Use synonyms
percent
of Change the spelling
per cent
total
in 1981, Insurance was the section with Add an article
the total
lowest
inflow. Despite climbing constantly to 8 Change the article
the lowest
Use synonyms
percent
, it held the lowest position during the given decades. Change the spelling
per cent
On the contrary
, the share of other Linking Words
worker's
salaries was 28 Fix the agreement mistake
workers'
Use synonyms
percent
, the second highest, Change the spelling
per cent
at
the beginning, which dropped to 22 and 15 Change the preposition
in
Use synonyms
percent
in 1991 and 2001 respectively. Change the spelling
per cent
AS
for furniture and equipment, after decreasing from 15 in 1981 to 5 Correct your spelling
As
Use synonyms
percent
in 1991, it stood at the second highest position by the end of the Change the spelling
per cent
last
decade, with 23 of every 100.Linking Words