
The charts illustrate the average
household
Use synonyms
energy
consumption Use synonyms
as well as
the Linking Words
amount
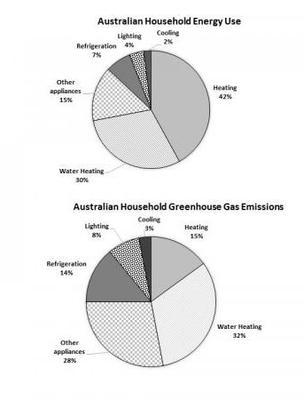
of harmful gas production in five groups in Australia.
Use synonyms
Overall
, the highest Linking Words
amount
of power is used for heating, Use synonyms
whereas
cooling accounts for the lowest Linking Words
amount
of Use synonyms
energy
use. Use synonyms
Moreover
, water heating can contribute to the most pollutant Linking Words
household
Use synonyms
energy
use as opposed to cooling.
In terms of Use synonyms
household
Use synonyms
energy
consumption, heating is the highest at approximately two-fifths and water heating accounts for the second most Use synonyms
energy
consumer Use synonyms
household
at just over a third. Use synonyms
In contrast
, the proportion of cooling Linking Words
energy
usage stays at 2% among Australian people.
As can be seen in the second chart, water heating releases the highest Use synonyms
amount
of greenhouse gas emissions at around a Use synonyms
third,
Linking Words
while
cooling is the least at exactly 3%. Linking Words
On the other hand
, heating produces as much gas as refrigeration does at less than a fifth.Linking Words