
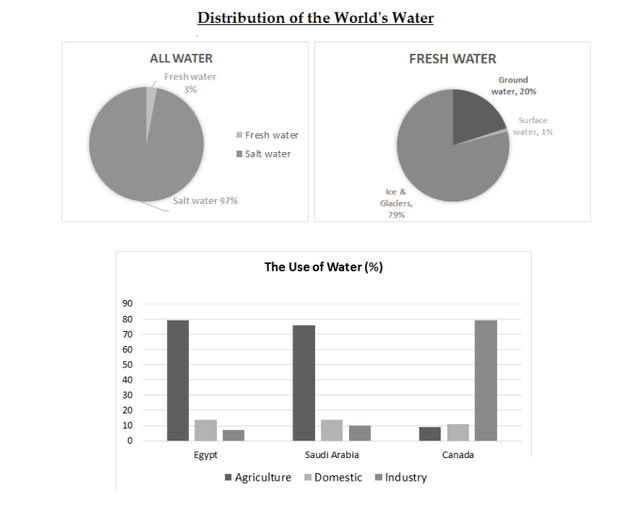
The pie chart illustrates how
water
is distributed around the world, and the bar chart represents the proportion of its use in various countries.
Use synonyms
Overall
the world is made of less fresh Linking Words
water
and from Use synonyms
this
type, ice and glaciers account for a large Linking Words
percent
. Replace the word
percentage
While
in Egypt and Saudia Arabia ,most of the Linking Words
water
made available Use synonyms
are
used for farming and similar practices, its use for Correct subject-verb agreement
is
this
same purpose was the least in Canada.
In the world and of all the bodies of Linking Words
water
, the salty variants Use synonyms
accounts
for 97% which is 30 times more than the fresh type. As for Fresh Change the verb form
account
Water
, ice and glaciers make up for more than half (79%) compared to the ground and surface types which are only 20% and 1% respectively .
Egyptians are Saudi Arabians, Use synonyms
consume
most of their Correct word choice
and consume
water
on farm practices but Use synonyms
this
Linking Words
the
opposite for Canadians who only use nearly 10% on agriculture.Add a missing verb
is the