The pie chart below shows the frequency of U.S. Adults’ online purchasing habits in 2015, while the bar chart shows a further classification denoting online purchasing preferences. Summarise the data by selecting and reporting the main features and make comparisons where relevant.

The pie chart below shows the frequency of U.S. Adults’ online purchasing habits in 2015, while the bar chart shows a further classification denoting online purchasing preferences. Summarise the data by selecting and reporting the main features and make comparisons where relevant.
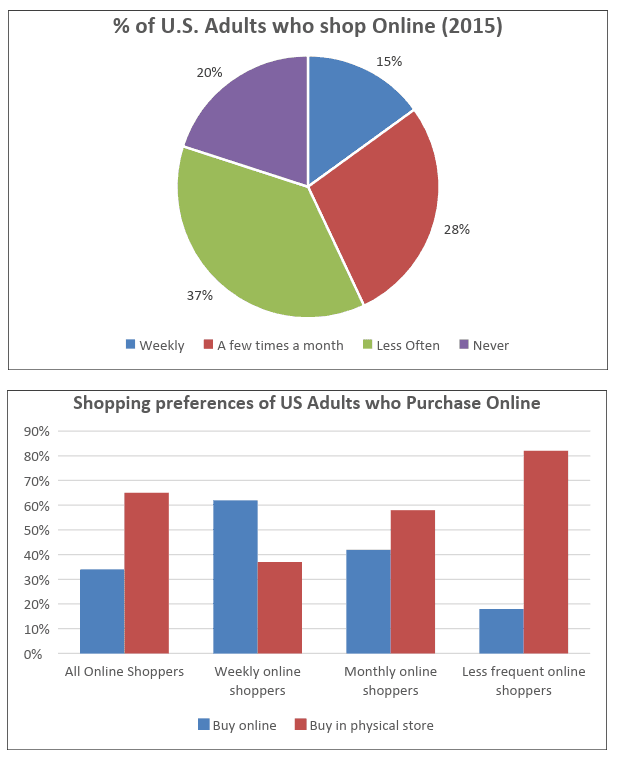
The pie chart gives information about the percentages of U.S. adults who bought products using
the
Correct article usage
apply
show examples
online platforms in 2015,
whereas
the given bar chart informs about those online buyers' preferences for purchasing goods from online
stores
and physical shops. In general, the biggest proportion of online purchasers habit in buying things is less often and the ratio of less frequent online shoppers who buy things in physical
stores
is the highest.
To begin
with, in 2015 American adults who less often purchase online experienced the highest percentage at 37%.
Then
the monthly online buyers accounted for 28% and the weekly online shoppers showed the smallest percentage at 15%.
While
those who never bought products online accounted for 20%. All of the online shoppers in America preferred to buy goods in physical
stores
, which accounted for more than 60%,
while
those who bought in virtual
stores
showed a little above 30%.
In addition
, the less frequent American online buyers who bought products at physical
stores
were slightly above 80%.
Submitted by e.warikar on

Unauthorized use and/or duplication of this material without express and written permission from this site’s author and/or owner is strictly prohibited. Excerpts and links may be used, provided that full and clear credit is given to Writing9 with appropriate and specific direction to the original content.

Sentences: Add more complex sentences.
Linking words: Don't use the same linking words: "while".
Vocabulary: Replace the words stores with synonyms.
Vocabulary: The word "chart" was used 2 times.
Vocabulary: The word "gives" was used 2 times.
Vocabulary: The word "showed" was used 2 times.
Vocabulary: The word "percentages" was used 3 times.
Vocabulary: The word "about" was used 2 times.
Topic Vocabulary:
  • pie chart
  • bar chart
  • online purchasing habits
  • frequency
  • classification
  • summarise
  • main features
  • comparisons
  • demographics
  • consumer trends
  • e-commerce
  • data interpretation
  • purchasing categories
  • fiscal analysis
  • technological influence
What to do next:
Look at other essays: