
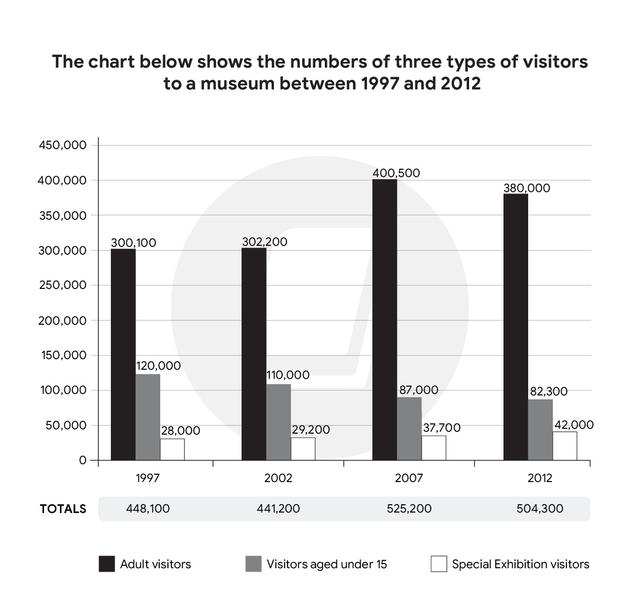
The graph provides information about how many visitors came to the
museum
from 1997 and 2010.
Use synonyms
Overall
, there was a growth in the total of people visiting Linking Words
this
Linking Words
museum
after 15 years Use synonyms
as a result
of an increasing number of adult and special exhibition visitors; meanwhile, the number of children who were under 15 years old saw a steady decrease throughout the period. Linking Words
In addition
, the annual numbers of adults had consistently the highest ones.
448,100 people spent time exploring the Linking Words
museum
at the beginning of the stage examined, followed by considerable oscillations in the next decade before ending at 504,300. A resembling change can be seen in the number of adults, which started at 300,100 before fluctuating in range from 302,000 to 400,500 before reaching 380,000 in 2012. Use synonyms
Similarly
, in 1997, only 28,000 visitors toured Linking Words
this
Linking Words
museum
, after which it experienced a gradual rise to 42,000 Use synonyms
at the end
of the period.
Linking Words
Conversely
, the figure for youngsters was 120,000 in 1997, with a subsequent decline to 110,000 in the next 5 years before continuing to drop to 82,300 in 2012.Linking Words