
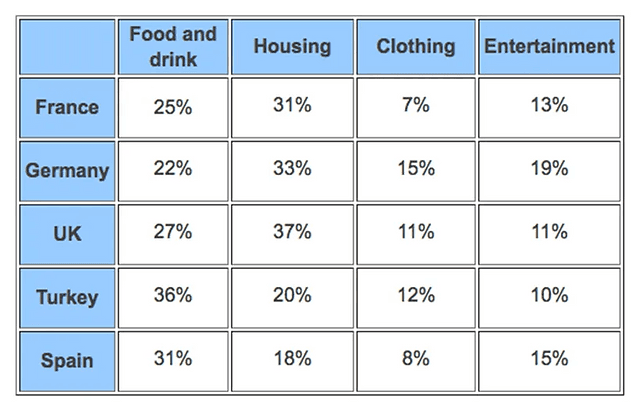
The household expenditures of five particular European nations in four distinct categories, namely food and beverage, accommodation, clothes and recreation are compared in the given chart.
Overall
, housing and daily eating and drinking are considered the most costly areas. Meanwhile, clothing and recreation fields took up a significantly lower proportion of money spent on them.
With regard to eating and beverage spending, Turkey takes the first place, recorded at more than one-third (36%), followed by Spain with a slightly lower figure, at 31%. Housing Linking Words
also
takes up the highest proportion of expenditure. Linking Words
While
the UK comprises the highest, at 37%, Spain contributes the least, recorded at one-fifth (18%). Linking Words
Although
France and Germany share the same pattern, at roughly one-Linking Words
third,
Turkey’s percentage is fairly lower, at 20%.
When it comes to amusement records, the difference between all five nations’ proportions marginally varies. Linking Words
However
, it is worth noting that Linking Words
while
having the highest number in food and drink, Turkey constitutes the lowest data in recreation, at just 10. Regarding the clothing field, its highest data is 15%, which belongs to Germany. Linking Words
In contrast
, France possesses the lowest figure, at only 8%.Linking Words