
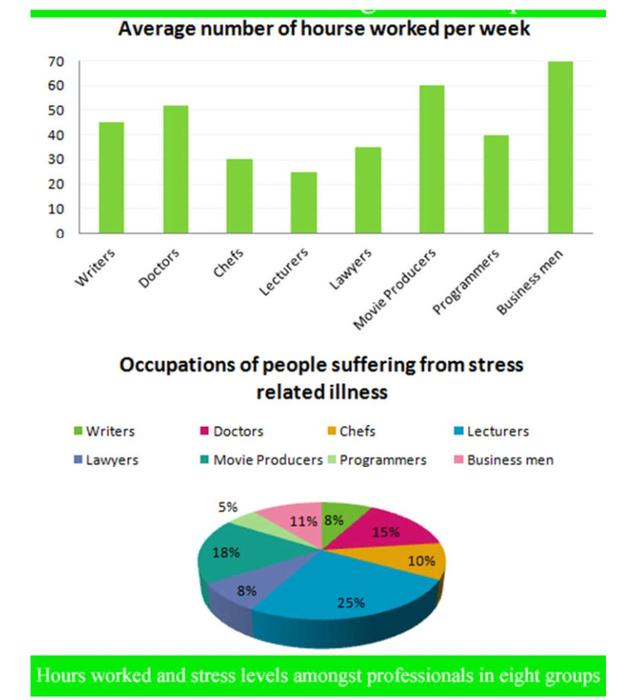
The bar chart illustrates
an
average number of working Correct article usage
the
hours
in a Use synonyms
week
divided by eight groups of jobs, Use synonyms
while
the pie chart depicts the Linking Words
stress
level between the professionals.
Use synonyms
Overall
, Linking Words
it is clear that
entrepreneur has the highest number of working Linking Words
hours
in a Use synonyms
week
, Use synonyms
whereas
Linking Words
lecturers
have the least. Use synonyms
However
, in terms of Linking Words
stress
level, Use synonyms
lecturers
are the most who have experienced Use synonyms
stress
in their job, Use synonyms
while
programmers have merely tension.
In terms of working time, businessmen spend almost 75 Linking Words
hours
in a Use synonyms
week
, followed by movie producers with just over 50 Use synonyms
hours
and doctors has approximately 50 Use synonyms
hours
. Use synonyms
Moreover
, authors consume more than 25 Linking Words
hours
which is higher than software engineers, lawyers, and Chefs. Use synonyms
Lecturers
, at the least, accounted for under 25 Use synonyms
hours
of work in a Use synonyms
week
.
Use synonyms
In contrast
, Linking Words
lecturers
are experiencing more Use synonyms
stress
in their employment (25%) even though their working Use synonyms
hours
are small compared to other occupations. Use synonyms
Next,
movie producers Linking Words
in
the second position with 25%, followed by doctors, executives, and chefs with 15%, 11%, and 10%, respectively. Add a missing verb
are in
However
, lawyers and writers have the same rates, and programmers have only 5%.Linking Words