
The pie chart indicates the transformation of travel in terms of two countries -
Australia
and Use synonyms
Germany
- from 1960 to 2010.
Use synonyms
Overall
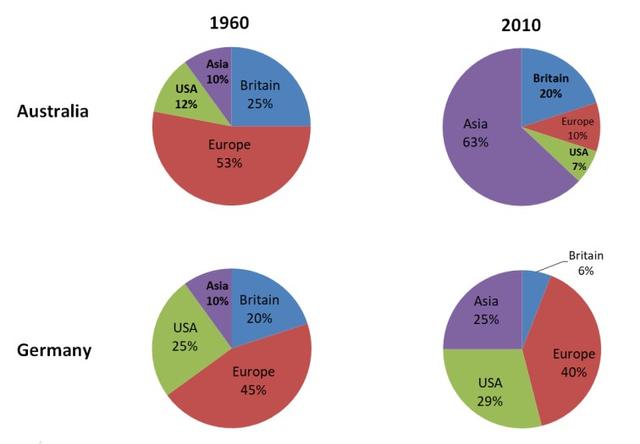
, travellers from Europe took up the largest segment in Linking Words
Australia
in 1960. Use synonyms
Similarly
, in Linking Words
Germany
, guests from Europe Use synonyms
also
accounted for the largest section in 1960. Notably, over a 50-year period, there was a remarkable shift in Linking Words
Australia
; tourists from Asia accounted for 63% of the whole tourism structure. Use synonyms
In contrast
, in Linking Words
Germany
, sightseers from Europe still took up the largest segment in 2010. At the same time, visitors from Britain became the smallest piece of travel, accounting for 6%.
Over the 50-year period, Use synonyms
Australia
experienced a significant modification. Asian tourists increased by 53%. Use synonyms
By contrast
, European visitors dropped by 43%. Meanwhile, the figures for tourists from the USA decreased from 12% to 1%, becoming the smallest segment in Australian tourism. Linking Words
Conversely
, touristry in Linking Words
Germany
did not change dramatically; European guests still represented the largest sector of Use synonyms
Germany
's travel, albeit with a decline of 5% between 1960 and 2010. Use synonyms
However
, the number of visitors from Britain dipped to 6%, becoming the smallest component of Linking Words
Germany
's tourism between 1960 to 2010.Use synonyms