
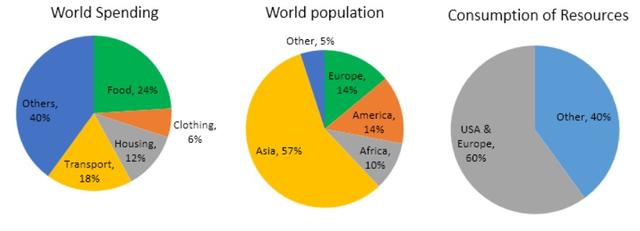
These pie charts illustrate data on resources on both expenditure and consumption worldwide. It is clear from the pie chart that the United States and the European countries are represented more than half of the
Use synonyms
world
consumption Change noun form
world's
by
about 60 Change preposition
apply
percent
. Change the spelling
per cent
According to
what is shown, most of the Linking Words
Use synonyms
world
population goes to Change noun form
world's
the
Asia which is considered by about 57 Correct article usage
apply
percent
. The proportion for both the US and Change the spelling
per cent
the
Europe exhibit a similar population at 14 Correct article usage
apply
percent
, Change the spelling
per cent
while
Linking Words
the
Africa and the rest of the Correct article usage
apply
world
are represented at 10% and 5%, respectively. Use synonyms
On the other hand
, the majority Linking Words
spending
goes Change preposition
of spending
to
Change preposition
on
the
food Correct article usage
apply
by
about 24%Change preposition
apply
Correct word choice
apply
whereas
, the transport, housing, and clothing Linking Words
are showing
the same increase pattern, Wrong verb form
show
including
Transport is represented at three times the amount of clothing at 18%, Change preposition
apply
while
housing is represented at twice the proportion of clothing at 12%. Clothing itself represents 6%, Linking Words
while
the rest of the proportion goes to other categories, amounting to 40%.
Linking Words
To sum up
, we could say that, the lowest Linking Words
world
population were for Use synonyms
an
Africa Correct article usage
apply
while
the smallest number of expenditure was for buying cloth.Linking Words