
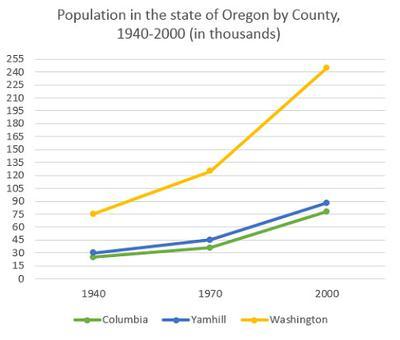
This
line graph portrays data about the alteration of dwellers in three regions of Oregon namely Linking Words
Columbia
, Use synonyms
Yamhill
and Use synonyms
Washington
in Use synonyms
USA
between 1940 and 2000.
Correct article usage
the USA
Overall
, what stands out from the graph is that there was a substantial rise in the proportion of inhabitants in Linking Words
Washington
throughout the period in question. Use synonyms
While
Linking Words
,
Remove the comma
apply
comlumbia
and Correct your spelling
Columbia
Colombia
Use synonyms
yamhill
witnessed a moderate ascension in Change the capitalization
Yamhill
this
regard.
Looking at the details, it is evident that Linking Words
Washington
's inhabitants were 75 Use synonyms
Use synonyms
thousands
and it increased gradually Change to singular
thousand
just
over 120 Change preposition
to just
Use synonyms
thousands
from 1940 to 1970. Change to singular
thousand
Additionally
, it reached a peak of well over around 240 Linking Words
Use synonyms
thousands
population over the next three decades.
Change to singular
thousand
In contrast
, Linking Words
Columbia
and Use synonyms
Yamhil
were less populated than Correct your spelling
Yamhill
Washington
during 1940-2000. Even though both Use synonyms
Columbia
and Use synonyms
Yamhill
followed Use synonyms
almost
similar Add an article
an almost
trend
, Fix the agreement mistake
trends
Use synonyms
yamhill
saw a slight incline at nearly 45 Change the capitalization
Yamhill
Use synonyms
thousands
of citizens in the first thirty years. Eventually, the number of people climbed Fix the agreement mistake
thousand
at
around 90 Change preposition
to
Use synonyms
thousands
till 2000 in the same province. Change to singular
thousand
Whereas
, in 1940, Linking Words
Columbia
had nearly 30 Use synonyms
Use synonyms
thousands
nationals which rose slightly over 30 Change to singular
thousand
Use synonyms
thousands
in 1970. Change to singular
thousand
Moreover
, there was a dramatic growth of individuals around 75 Linking Words
Use synonyms
thousands
up to 2000 in the same region.Change to singular
thousand