
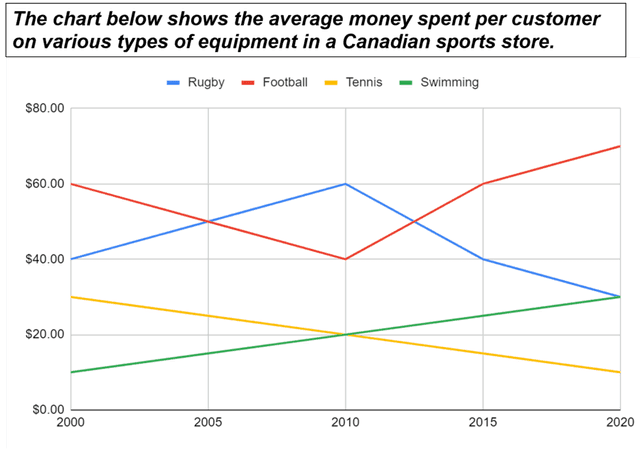
The line graph illustrates the average budget allocation per capita on different types of equipment in a Canadian sports store between 2000 and 2020.
Overall
, it can be seen that the football and swimming categories showed positive trends, Linking Words
while
rugby and tennis experienced downward trends.
Linking Words
To begin
with, football's starting point marked the highest customer spending in 2000 which stood at $60.00. Linking Words
However
, it Linking Words
was
slightly decreased until 2010 to $40.00, but bounced back and became the biggest revenue source in 2020 which accounted for around $70.00. Unnecessary verb
apply
Moreover
, the swimming section went up gradually from about $10,00 in 2000 to approximately $30,00 in 2020.
Linking Words
On the contrary
, rugby equipment sales grew considerably and reached the peak point at $60.00 in 2010, but dropped dramatically to around $30,00 in 2020. Linking Words
Additionally
, there was a constant decline in tennis spending. It began at $30.00 in the initial year, but there was no progress throughout the years and only contributed less than $20.00 Linking Words
at the end
of the given period.Linking Words