
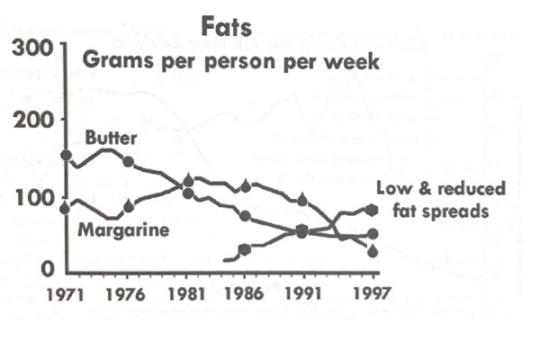
The line graph shows the changes in the consumption of fats from 1971 to 1997.
Overall
, the number of two types of fat including butter and margarine tended to decrease, Linking Words
while
the figure for low and reduced fat spreads increased considerably.
As can be seen in the graph, commencing at approximately 150 Linking Words
grams
weekly per person in 1971, the figure for butter Use synonyms
then
had a slight reduction in 1981. Linking Words
Following
Linking Words
this
, the number declined significantly after more than 20 Linking Words
years
to roughly 50 Use synonyms
grams
.
The second type of fat, margarine reached 100 Use synonyms
grams
in 1971 and ranked second. Use synonyms
This
type of fat has a lot of fluctuation in the number of consumers compared to the other two types. After 5 Linking Words
years
, in 1976, the amount of margarine consumed decreased by about 20 Use synonyms
grams
per person. After that, the graph of Use synonyms
this
type of fat continued to increase and decrease over the Linking Words
years
until 1997 reached the lowest amount of about 20 Use synonyms
grams
.
The statistics Use synonyms
also
show that consumption of low and reduced fat spreads that began appearing in 1986 reached approximately 20 Linking Words
grams
. More than ten Use synonyms
years
later, Use synonyms
this
fat data in 1997 was four-fold the data in 1986.Linking Words