
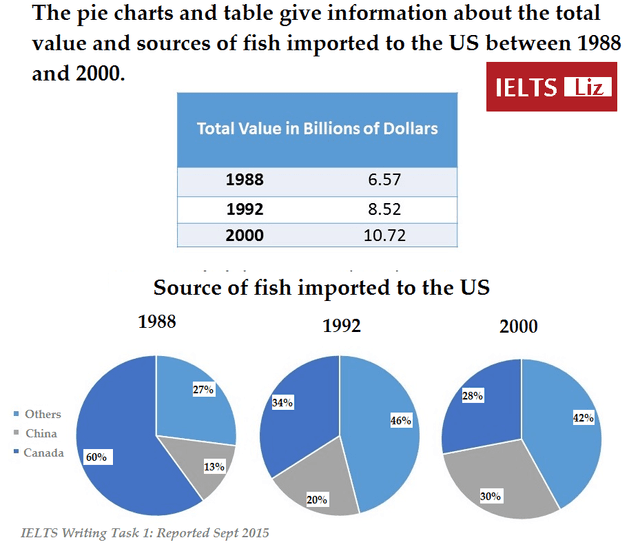
The pie charts and table show details about the total value and sources of
fish
imported into the United States between the years 1988 and 2000.
Use synonyms
Overall
, at first sight, Linking Words
it is clear that
the total value is billions of dollars in three periods. Linking Words
Also
, the sources of Linking Words
fish
imported to the US, are divided into three categories, Use synonyms
China
, Use synonyms
Canada
and other regions.
At the beginning of the year 1988, the total rate in billions of dollars represents a number of 6.57. Use synonyms
In addition
, for the same year, The country of Linking Words
Canada
is the source of Use synonyms
fish
the most used with 60% which is very significant. Use synonyms
in contrast
to 27% for the rest and only 13% for Linking Words
China
.
In 1992, the total amount illustrates a number of 8.52. Use synonyms
Then
, 46% of sources of Linking Words
fish
are in other countries, with 34% in Use synonyms
Canada
and 20% in Use synonyms
China
, which shows an evolution.Use synonyms
Additionally
, Linking Words
at the end
of 2000, the total amount increased to 10.72, Linking Words
however
, the pie charts illustrate a diminution for Linking Words
Canada
with 28% and 42% for the others. Use synonyms
In contrast
Linking Words
China
with a percentage of 30.Use synonyms