The charts show world pineapple exports by the top three pineapple-producing countries in 2009 and 2019, and a breakdown of the cost to the consumer of each pineapple in 2019. Summarise the information by selecting and reporting the main features, and make comparisons where relevant.

The charts show world pineapple exports by the top three pineapple-producing countries in 2009 and 2019, and a breakdown of the cost to the consumer of each pineapple in 2019. Summarise the information by selecting and reporting the main features, and make comparisons where relevant.
IELTS Writing Task Chart for The charts show world pineapple exports by the top three pineapple-producing countries in 2009 and 2019, and a breakdown of the cost to the consumer of each pineapple in 2019. Summarise the information by selecting and reporting the main features, and make comparisons where relevant.
✨ Do you want to improve your IELTS writing?
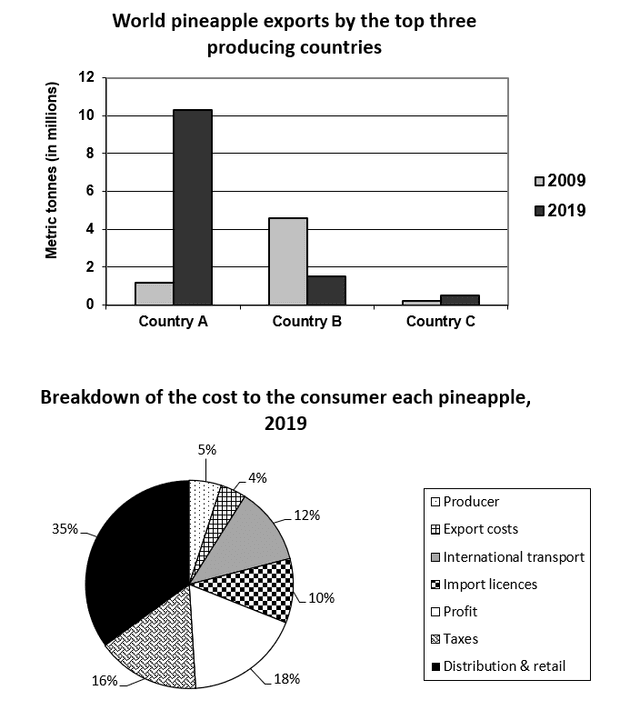
The bar graph illustrates the top three
pineapple exporting
Add a hyphen
pineapple-exporting
show examples
countries in the world
during
Change preposition
between
show examples
2009 and 2019.
While
Linking Words
the pie chart provides information about the breakdown of the cost to customers of a single pineapple in 2019
,.
Change the punctuation
,
.
show examples
Overall
Linking Words
, it is evident that
Country
Use synonyms
A' was the highest exporter of pineapples in the year 2019,
whereas
Linking Words
Country
Use synonyms
B was the lowest exporter among all the nations. In the pie chart, distribution and retail had more than a third
percent
Change the spelling
per cent
show examples
in 2019. The bar graph, in 2009,
country
Use synonyms
B had the highest distribution of nearly
about
Rephrase
apply
show examples
5 tone
metric
Fix the agreement mistake
metrics
show examples
in millions.
However
Linking Words
, in 2019,
Country
Use synonyms
A reached its peak at around 10 metric tons (in millions).
Furthermore
Linking Words
,
Country
Use synonyms
C hovered around 2 metric tons in millions in both years. Turning to the second picture, 35% of distribution and retail was by far the largest, which was seven times higher than the 5% of the producer sector. The lowest are the export costs, which are only 4%. The figures for the other four kinds of profit—taxes, international transport, and import licenses—were kept roughly in the range of 10% to 16%.

Unauthorized use and/or duplication of this material without express and written permission from this site's author and/or owner is strictly prohibited. Excerpts and links may be used, provided that full and clear credit is given to Writing9 with appropriate and specific direction to the original content.

Vocabulary: Replace the words country with synonyms.
Vocabulary: Rephrase the word "information" in your introduction.
Vocabulary: The word "chart" was used 2 times.
Vocabulary: The word "graph" was used 2 times.
Vocabulary: The word "about" was used 2 times.
Vocabulary: The word "around" was used 2 times.
Topic Vocabulary:
  • charts
  • world pineapple exports
  • top three producing countries
  • 2009
  • 2019
  • breakdown
  • cost to the consumer
  • main features
  • comparison
  • relevant
What to do next:
Look at other essays: