You should spend about 20 minutes on this task. The graph below shows the different modes of transport used to travel to and from work in one European city in 1960, 1980 and 2000. Write a report for a university lecturer describing the information below. You should write at least 150 words.

You should spend about 20 minutes on this task.

The graph below shows the different modes of transport used to travel to and from work in one European city in 1960, 1980 and 2000.

Write a report for a university lecturer describing the information below.

You should write at least 150 words.
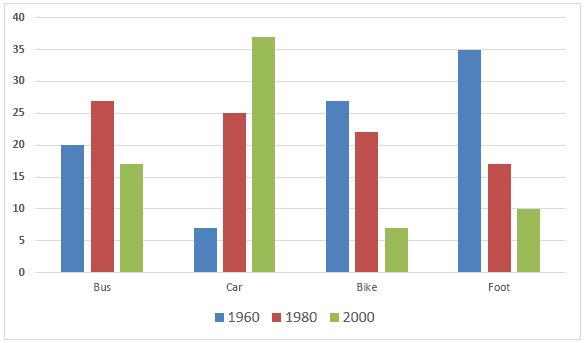
The bar chart displays various vehicles that people used to go to and return from their workplaces in European cities in three diverse years - 1960, 1980 and 2000.
Overall
, the primary trend has changed a lot over the years: the values of preferences fluctuated significantly, but the indicators of trains and tubes were nearly the same,
in addition
, cars and buses were similar. From the graph, we can see that the use of the train waved. In 1960, the percentage of commuters on the train was 18% and in 2000 amounted to 21%.
Accordingly
, tube use had the same tendency, because it started at 27% and ended at 25%.
On the other hand
, the car sector began with the smallest percentage but it had an explosion and in 2000 it gained the highest score. Following, the use of the bus has considerably decreased, its numbers were about 38 in 1960 and dropped to 15% in 2000.
Submitted by baonhi260804 on

Unauthorized use and/or duplication of this material without express and written permission from this site’s author and/or owner is strictly prohibited. Excerpts and links may be used, provided that full and clear credit is given to Writing9 with appropriate and specific direction to the original content.

Sentences: Add more complex sentences.
Vocabulary: The word "percentage" was used 2 times.
What to do next:
Look at other essays: