
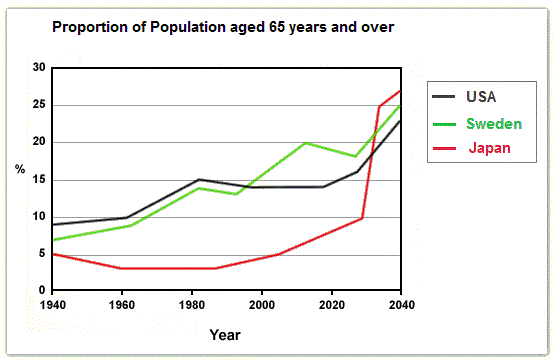
The line graph compares the percentage of people aged 65 or more in the
USA
,Use synonyms
Japan
and Use synonyms
Sweden
from 1940 to 2040.
In 2028Overall, it is immediately apparent from the chart Use synonyms
Japan
had a maximum number of residents aged 65 and more in the final year,Use synonyms
however
, Linking Words
Sweden
and the Use synonyms
USA
Use synonyms
also
followed the positive trend and population of senior adults search over the years.
Linking Words
To begin
with,the percentage of old people the age Linking Words
beganat
5% in Correct your spelling
began at
Japan
in 1920. After a few years, it decreased three times.Use synonyms
However
,in 2000 it grew in Linking Words
Japan
. The proportion of 65 and above was the highest in the Use synonyms
USA
in 1940. Use synonyms
This
was twice as high as in Linking Words
Sweden
and Use synonyms
Japan
. But in 2020 Use synonyms
Japan
has grown out of Use synonyms
USA
and Use synonyms
Sweden
,
Use synonyms
that is
, it reached 25%.
Despite some deviations between them, the old age population in Linking Words
Sweden
and the Use synonyms
USA
Use synonyms
alsois
estimated to rise, and by 2040, it Correct your spelling
is is
would
hit 25% respectively. The number of Wrong verb form
will
Japan
's elderly population has skyrocketed by 2030,and 2040 remains the same. But, starting with very few arrows, Use synonyms
Japan
overtook everyoneUse synonyms