
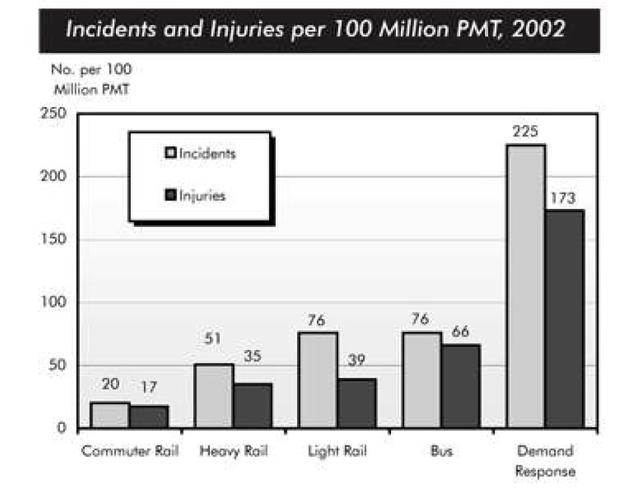
The bar graph displays the numbers of
incidents
and Use synonyms
injuries
for every 100 million passenger miles travelled on five different types of public transport in 2002.
Use synonyms
Overall
, most Linking Words
incidents
and Use synonyms
injuries
took place on demand-respond vehicles. Use synonyms
By contrast
, commuter Linking Words
rail
Use synonyms
services
recorded by far the lowest figures.
A total of 225 Use synonyms
incidents
and 173 Use synonyms
injuries
, per 100 million passenger miles travelled, took place on demand-respond transport service. These figures were nearly three times as high as those for the second highest category, bus Use synonyms
services
. There were 76 Use synonyms
incidents
and 66 people were injured on buses.
Use synonyms
Rail
Use synonyms
services
experienced fewer problems. The number of Use synonyms
incidents
on light Use synonyms
rail
trains equalled the figure recorded for buses, but there were significantly fewer Use synonyms
injuries
, at only 39. Heavy Use synonyms
rail
Use synonyms
services
saw a lower number of Use synonyms
incidents
than light Use synonyms
rail
Use synonyms
services
, but the figure of Use synonyms
injuries
was nearly equal to those for light Use synonyms
rail
Use synonyms
services
. Commuter Use synonyms
rail
passengers were even less likely to experience problems, in fact, only 20 Use synonyms
incidents
and 17 Use synonyms
injuries
occurred on commuter trains.Use synonyms