
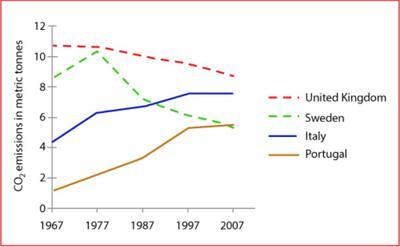
The graph provides information on the average per capita carbon dioxide
emissions
of four countries from 1967 to 2007.
Use synonyms
Overall
, Linking Words
it is clear that
Linking Words
while
the UK has the highest average CO2 Linking Words
emissions
, Sweden's Use synonyms
output
has fallen over the same period. At the same time, people in Italy and Portugal showed a significant rise in their Use synonyms
emissions
levels.
In 1967, UK production led to the highest levels of pollution, resulting in approximately 11 metric Use synonyms
tonnes
of CO2 per personUse synonyms
..
The next highest emitters were the Swedes, responsible for around 8.5 Replace the punctuation
.
...
tonnes
per person, which is two times the average Italian Use synonyms
output
and 16 times the average Portuguese Use synonyms
output
Use synonyms
..
The UK's CO2 Replace the punctuation
.
...
output
has fallen gradually over the past 40 years, but despite a surge in 1970, people in Sweden Use synonyms
also
cut their Linking Words
emissions
dramatically until 2007Use synonyms
..
They account for only 5 metric tons each.
Replace the punctuation
.
...
By contrast
, after 1967, Linking Words
emissions
from Italy and Portugal increasedUse synonyms
..
Replace the punctuation
.
...
At the end
of the given period, Italy was the second highest polluter, with about 8 metric Linking Words
tonnes
, Use synonyms
while
in Portugal, Linking Words
although
it was still the lowest emitter Linking Words
along with
Sweden, just under 6 metric Linking Words
tonnes
were produced per person.Use synonyms