
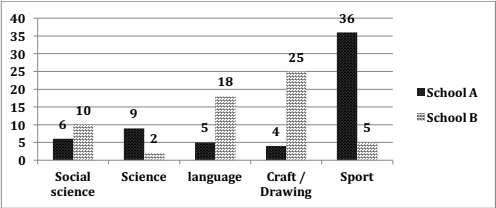
The graph illustrates data about the dearest subjects of
pupils
from Use synonyms
school
A and Use synonyms
school
Use synonyms
B
.In short,It is seen that both Use synonyms
school
's Use synonyms
students
like extra-curricular disciplines to read more than others.
In detail,Use synonyms
school
A student's most-liked subject is sport,which is red by 36 Use synonyms
pupils
.Use synonyms
While
25 Linking Words
students
from Use synonyms
school
Use synonyms
B
love to studt craft subject.Use synonyms
This
number is the highest in Linking Words
school
Use synonyms
B
.The second most favourite subject from Use synonyms
school
A is science,9 Use synonyms
pupils
are keen to read it.Use synonyms
On the other hand
,18 Linking Words
students
from Use synonyms
school
Use synonyms
B
read language subjects the most after drawing.Social science stands in third place,6 and 10 Use synonyms
pupils
like to study it at Use synonyms
school
A and Use synonyms
school
Use synonyms
B
respectively.Use synonyms
However
,five Linking Words
students
from Use synonyms
school
A best-loved discipline is language.Meanwhile,sports in Use synonyms
school
Use synonyms
B
are liked by the same number of Use synonyms
pupils
.
The least loved subjects of Use synonyms
students
in both schools are science and craft.In Use synonyms
school
A only 4 Use synonyms
pupils
like to study crafts.Use synonyms
While
only 2 Linking Words
students
want to read sports in Use synonyms
school
Use synonyms
B
.Use synonyms