
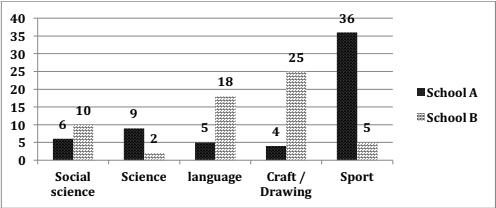
The chart illustrates the comparison of the popular subjects between two junior high schools.
Overall
, these schools have different preferences in choosing their Linking Words
favorite
field of subjects. Most Change the spelling
favourite
students
in Use synonyms
School
A prefer to select sports. Use synonyms
On the other hand
, the Linking Words
favorable
Change the spelling
favourable
subject
in Use synonyms
School
B is Use synonyms
craft
.
In Add an article
a craft
School
A, sports Use synonyms
subject
has a lot of enthusiasts up to 36 Use synonyms
students
. In the second one, nine Use synonyms
students
like Use synonyms
science
. Followed by social Use synonyms
science
which is chosen by six Use synonyms
students
, and five Use synonyms
students
are selected for language. The lowest selected Use synonyms
subject
is drawing.
In Use synonyms
School
B, drawing is the highest portion that was chosen by 25 Use synonyms
students
. The next popular Use synonyms
subject
is language, with the number of Use synonyms
students
who were like are 18 people. Followed by social Use synonyms
science
which is chosen by 10 Use synonyms
students
, and five Use synonyms
students
are like the sport. The Use synonyms
science
had at least Use synonyms
interested
with only two Replace the word
interest
students
.Use synonyms