
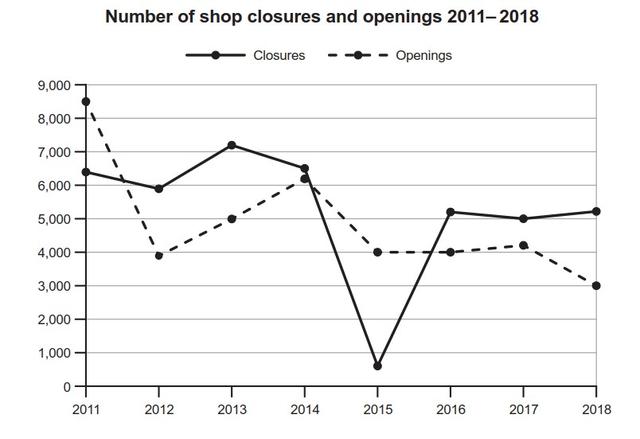
The given graph illustrates how many stores that were closed and opened in a country from 2011 to 2018.
Overall
, it can clearly be seen that the number of shop openings and closures fluctuated during the given period. At the start of the period, the opened shops were the most dominant which were replaced by the closed ones from 2016 to the final year.
Linking Words
Although
in the first year, the opened stores stood at about 8,500 compared to the closed ones which began at approximately 6,500, it decreased dramatically to just below 4,000 in 2012. The openings Linking Words
then
saw a significant rise to just above 6,000 in 2014 before dropping again to exactly 3,000 and became the lowest one in the final period.
Regarding the number of closed shops with the lower level at the beginning, it experienced a slight incline and took over the trend in 2013 at just above 7,000 before decreasing significantly to the lowest at almost 500 in 2015. Linking Words
Thereafter
, it witnessed a dramatic climb to about 5,000 in 2016 and became the dominant one in the following years.Linking Words