
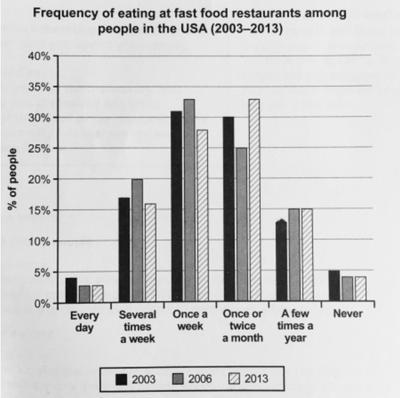
The bar graph provides information on the
percentage
of Use synonyms
people
who consumed fast Use synonyms
food
in the USA restaurants in the Use synonyms
years
2003, 2006 and 2013. Use synonyms
Overall
, it is seen that most Linking Words
people
in all the Use synonyms
years
ate Use synonyms
food
in restaurants either once a week or twice a month, Use synonyms
however
, the minority was seen in the extremes where Linking Words
people
either at every day or never consumed outside Use synonyms
food
.
The Use synonyms
percentage
of residents in the USA who took away Use synonyms
food
from restaurants every day was less than 5% in the year 2003 which Use synonyms
further
decreased to 3% by 2013. Linking Words
Similarly
, the Linking Words
percentage
declined in Use synonyms
people
who never ate outside from 5 to 4 in the given period.
Individuals who packed meals from eatery serval times a week shot up from 17% in 2003 to 20% in 2006 but plummeted to 16% by 2013. The Use synonyms
percentage
, in terms of Use synonyms
people
who ate outside a few times a year increased from 13 in 2003 to 15 in 2006 and remained stable by the end of the period.
The highest proportion was reported at 31 where Use synonyms
people
in 2003 preferred quick service once a week which increased to 33% and Use synonyms
then
declined to 27% in 10 Linking Words
years
. With the US citizens who chose to eat fast Use synonyms
food
once or twice a month , the Use synonyms
percent was
decreased to 5% from 2003 to 2006 and significantly increased to almost 35% in Correct your spelling
percentage
next
7 Correct article usage
the next
years
.Use synonyms