
A glance at
two
graphs provided reveals the main culprits why agricultural Correct article usage
the two
land
becomes more unproductive and how these causes affected three sectors of the world, measured in Use synonyms
percent
, during the 1990s. Change the spelling
per cent
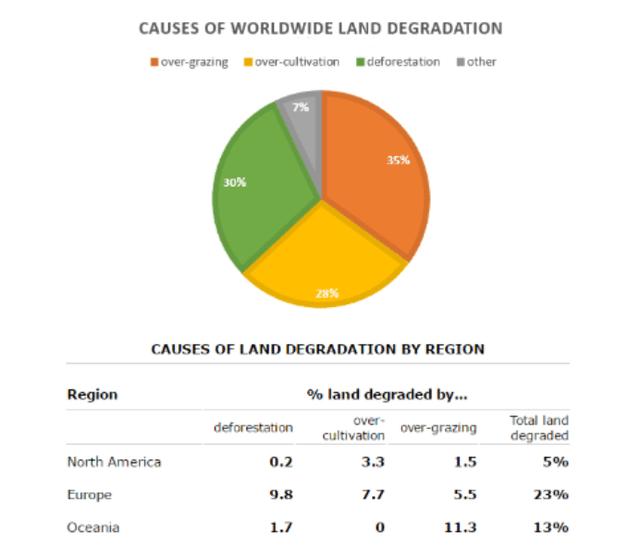
Overall
, over-grazing was the main cause of worldwide Linking Words
land
degradation and Europe experienced the most remarkable effect of Use synonyms
land
degradation.
In terms of the reasons leading to Use synonyms
the
global Correct article usage
apply
land
deterioration, over-grazing accounted for the most remarkable proportion with 35, narrowly followed by deforestation and over-farming at 30 and 28 respectively. Meanwhile, others made up the least significant number with 2.
As for the justification Use synonyms
triggering
the degradation in Change preposition
for triggering
land
quality by specific areas, Europe suffered from the most impact with 23% of total Use synonyms
land
degraded. At the opposite end of the scale, just 5% of the total Use synonyms
land
of North America was eroded. Use synonyms
On the other hand
, 13% of the Linking Words
land
was negatively damaged in Oceania. To be more specific, regarding Europe, the key factor leading to Use synonyms
land
erosion was deforestation with 9,8%, followed by over-farming and over-grazing with 7,7 and 5,5 respectively. With respect to Oceania, over-grazing played an important role in soul destruction with 11,3%. At the opposite end of the scale, there was no response detecting any emergence of over-cultivation impact in the chart. As for North America, over-cultivation was the most outstanding influence element with 3,3%.Use synonyms