
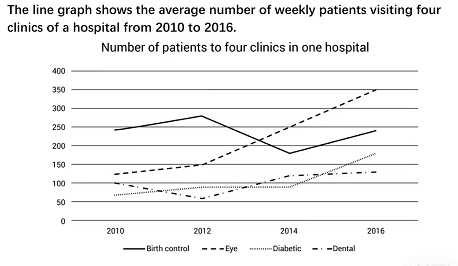
This
graph illustrates the average Linking Words
number
of weekly Use synonyms
patients
visiting four different clinics: birth control, eye, diabetic and dental in the hospital between 2010 and 2016
Use synonyms
According to
the line graph, all four clinics had increased by 2016 and in Linking Words
Correct article usage
the begining
begining
the Correct your spelling
beginning
popular
Correct quantifier usage
most popular
clinic
was birth control, but Use synonyms
at the end
of the Linking Words
survey
the eye Add a comma
survey,
clinic
became the most popular among the Use synonyms
patients
.
The graph provides strong evidence, that Use synonyms
birth
control section of the hospital had about 248 Correct article usage
the birth
patients
in 2010, it expanded slightly to about 275 Use synonyms
people
Use synonyms
till
2012. Change preposition
by
Although
, between 2012 and 2014 it significantly declined to 175 humans, but till 2016 Linking Words
this
figure recovered to almost 250 Linking Words
people
. Use synonyms
In contrast
, the Linking Words
number
of Use synonyms
patients
in eye Use synonyms
Use synonyms
clinic
in 2010 stood at 125 and between 2010 and 2016 it climbed dramatically to 350 Fix the agreement mistake
clinics
people
.
Meanwhile, the diabetic one had a bit more than 50 Use synonyms
patients
in 2010, till 2012 there was Use synonyms
gentle
rise to almost 100 Correct article usage
a gentle
people
, and that figure was the same till 2014. After Use synonyms
that
its Add a comma
that,
number
grew to about 280 Use synonyms
patients
. In comparison, the Use synonyms
number
Use synonyms
at
dental Change preposition
of
Use synonyms
clinic
was 100 individuals in 2010. Fix the agreement mistake
clinics
However
, till 2012 there was Linking Words
fall
to 50 Correct article usage
a fall
people
, but Use synonyms
then
it climbed to almost 150 Linking Words
people
Use synonyms
till
2016.Change preposition
by