
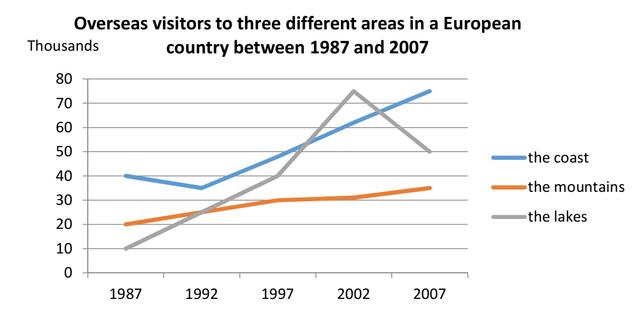
The graph illustrates the figure of foreign
visitors
to dissimilar areas in a European country which feature The coast, The mountains, and The lakes, in five different years.
Use synonyms
Overall
, the highest figure was on the coast in the Linking Words
year
2007, Use synonyms
whereas
the second Linking Words
number
was the lakes which were down in the Use synonyms
year
2007. Use synonyms
In addition
, the third amount which had raised incrementally from 1998 until 2007, that were in the mountains.
glancing at the graph reveals that humans in 1987 travelled to the coast with several 40000 the Linking Words
number
dwindle in 1992, after Use synonyms
that
the figure increased sharply over the next years to end by 75 Add a comma
that,
thousand
Use synonyms
visitors
. Use synonyms
Hence
, people who had travelled to the lakes were the least in the Linking Words
year
1987, but it goes up from 40 Use synonyms
thousand
Use synonyms
visitors
in the Use synonyms
year
1997 to 75 Use synonyms
thousand
in the Use synonyms
year
2002, Use synonyms
in contrast
, the amount down drastically in the Linking Words
year
2007. Use synonyms
However
, the consistent Linking Words
number
of Use synonyms
visitors
who travelled to the mountains was 20 Use synonyms
thousand
in the Use synonyms
year
1987, but Use synonyms
this
Linking Words
number
kept increasing gradually until 2007 to end with 25 Use synonyms
thousand
Use synonyms
visitors
.Use synonyms