
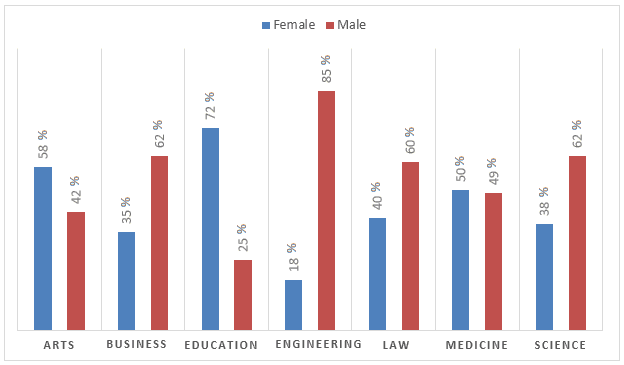
The bar chart illustrates the count of academic
staff
in the Arts, business, education, law, Use synonyms
medicine
, and science Use synonyms
faculties
in 2012 based on gender.
In general, the majority of faculty employment was male. Use synonyms
In contrast
, Linking Words
medicine
had a sharp Use synonyms
gap
between males and females.
In terms of males in the Use synonyms
Use synonyms
faculties
Change noun form
faculty's
staff
, we can see the highest proportion was in engineering, with a count of 85%. Use synonyms
Furthermore
, the number of men employers more a half was business, law, and science, which the value were approximately 65%, 60%, and 63%, respectively. Linking Words
Therefore
, the highest Linking Words
gap
between male and women employers was in engineering, with the Use synonyms
gap
being a fourth of total employers.
Regarding female jobs in the several Use synonyms
faculties
, we can see the highest Use synonyms
staff
in education Use synonyms
faculties
was women, with the number of Use synonyms
staff
reaching more than 70%. Followed by arts, Use synonyms
medicine
, law, science, business, and engineering, where the value of women Use synonyms
staff
were approximately 58%, 50%, 40%, 38%, 35%, and 15%, respectively. Use synonyms
Moreover
, the small Linking Words
gap
between males and females was faculty of Use synonyms
medicine
, which was a Use synonyms
gap
of only approximately 1%.Use synonyms