
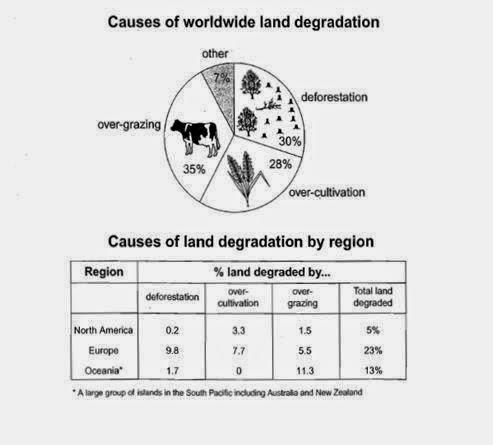
The pie chart compares the proportion of main causes which affected the productivity of lands in terms of agriculture,
while
the table shows the information in North America, Europe, and Oceania in the 1990s.
Linking Words
Overall
, over-grazing was the most important reason around the world, Linking Words
while
that for Europe as the first region, which suffered from Linking Words
land
degradation, was Use synonyms
deforestation
.
Use synonyms
According to
the pie chart, Linking Words
It is clear that
the highest share of reasons for damaging Linking Words
land
fertile was over-grazing, accounting for 35%, followed by Use synonyms
deforestation
, recorded at just under a third. The amount for over-cultivation was lower than Use synonyms
deforestation
by 2%, Use synonyms
while
that for other factors was only 7%.
Regarding the details of the table, the total less productive Linking Words
land
was 23% in Europe, stood in Use synonyms
the
first place, Correct article usage
apply
moreover
, the main reason was Linking Words
deforestation
. Use synonyms
However
, over-grazing was the main destroying cause in Oceania and stood in second place for total Linking Words
land
degraded, by 10% lower. Use synonyms
Finally
, North America was the least affected area at 5%.Linking Words