
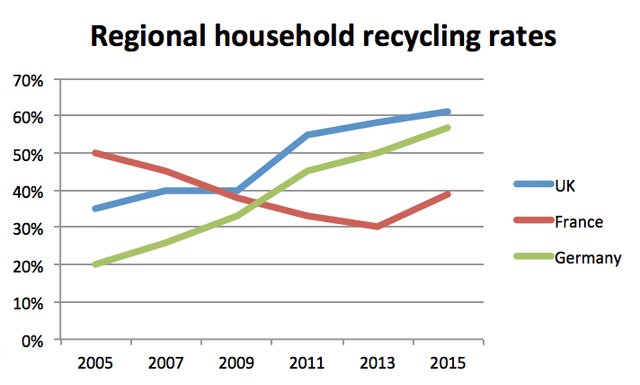
The chart demonstrates the amount of household recycling in three different countries the UK, France and Germany over a fifteen-year period from 2005 to 2015. The X-axis illustrates the years and the Y-axis depicts the ratio of household recycled.
Overall
, what sticks out from the graph is that Linking Words
while
the percentage of household recycling in the UK and Germany grew over the period in question, the proportion in France fell sharply.
Looking at the details, with regards to the UK, the rate increased steadily from 35% in 2005 to 40% in 2007, Linking Words
then
it levelled off until 2009, after which it soared to 55% in 2011. Linking Words
Following
Linking Words
this
, takings enhanced steadily to reach above 60% in 2015, which was the highest standard compared to others in any year.
Turning to France, though it started from the pinnacle of 50% in 2005, it decreased sharply to 30% in 2013, Linking Words
then
it slipped back to 40% in 2015.
In the case of Germany, there was a slow enhancement quota from 20% in 2005, which was the lowest value for any country in any year, to about 35% in 2009, before a sharp expansion of 45% in 2011. Linking Words
Finally
, it peaked at around 58% in 2015 with a small incremental rate.Linking Words