
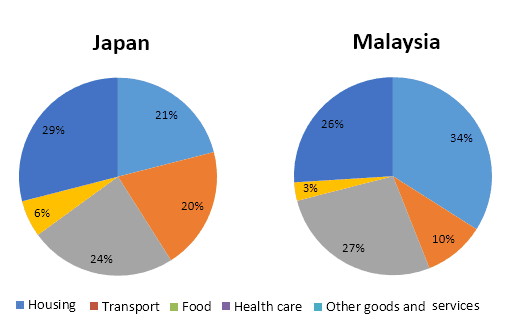
The pie chart demonstrates the mediocre homestead spending in
Japan
and Use synonyms
Malaysia
in 2010. The essay describes the main points and compares the key information.
Use synonyms
Overall
, the significant cost of household other goods and services and food in Linking Words
Japan
, contrast in Use synonyms
Malaysia
housing is the prominent sector where they spend more finance. Use synonyms
Moreover
, the expenditure on healthcare and transport in Linking Words
Japan
was double the figures for Use synonyms
Malaysia
.
With regards to Housing expenditure, the Malaysian people spent a large portion of finance about 34% Use synonyms
whereas
the trajectory was only 21 per cent cost in Linking Words
Japan
. Use synonyms
In addition
, the cost of other goods and services is a significant ratio of about 29% in Linking Words
Japan
, Use synonyms
besides
26% of spending money in Linking Words
Malaysia
.
Use synonyms
On the other hand
, the amount of food was quite similar about 24% in Linking Words
Japan
and 27 per cent in Use synonyms
Malaysia
respectively. Meanwhile, the expenses for transport were about 20% in Use synonyms
Japan
which was half in Use synonyms
Malaysia
. Though the health sector is crucial for individuals, they allocate very negligible amounts of funding Use synonyms
such
as 6% and 3% proportionately.Linking Words