
The bar chart illustrates changes
within
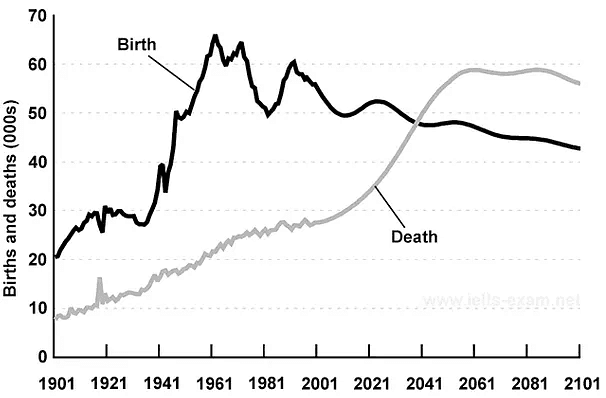
the birth and passing rates in New Zealand throughout the period from 1901 to 2101.
Looking from an Change preposition
in
overall
perspective, it is readily apparent that both given criteria despite the fluctuation over 200 years witnessed an upward trend. Linking Words
however
, the birth rate Linking Words
although
had sharply increased, experienced a gradual decline.
From the given figure it can be seen that the number of births in 1901 was almost 20 each Linking Words
second
Use synonyms
this
number variation in 1961 to reach the highest amount of nearly 70 childbirths each Linking Words
second
Use synonyms
then
it had ups and downs to about 55 newborn children in each Linking Words
second
by the year of 2001. Use synonyms
however
, it is predicted that Linking Words
this
amount would start to drop moderately to just over 40 babies in 2101.
Linking Words
On the other hand
, the death rate was just under 10 people in Linking Words
second
in 1901 and Use synonyms
this
figure fluctuation until 2001 Linking Words
then
it started to grow significantly to approximately 60 death per Linking Words
second
in 2061 same as the birth rate it is anticipated that Use synonyms
this
number would drop down to just near as 60 individual death in 2101.Linking Words