
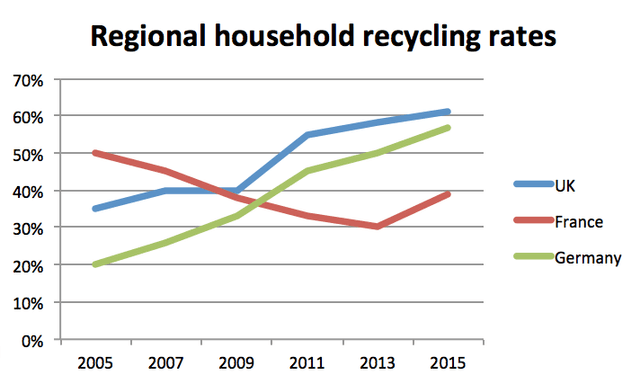
The line chart presents data about household recycling rates in three countries including France,
Germany
, and the Use synonyms
UK
from 2005 to 2015.
From an Use synonyms
overall
perspective, the recycling rate increased during the period in the Linking Words
UK
and Use synonyms
Germany
, but it decreased in France. Looking at details, the red line on the graph related to France gives information on the permanent decline in recycling from 50 to 30 per cent between 2005 and 2013, Use synonyms
then
it grew to 40 per cent over a five-year course to 2015. Linking Words
According to
the diagram, Linking Words
Germany
and the Use synonyms
UK
rose in discussed topic from 20 to 57 and 33 to 60 per cent, respectively.
The thing to point out is Use synonyms
Germany
has a gradual climb but the Use synonyms
UK
had a steady period from 2007 to 2009. Use synonyms
Also
, it can be seen that Linking Words
Germany
had a sharper regression line than the Use synonyms
UK
. Use synonyms
Furthermore
, its distance got closer to the endpoint.Linking Words