
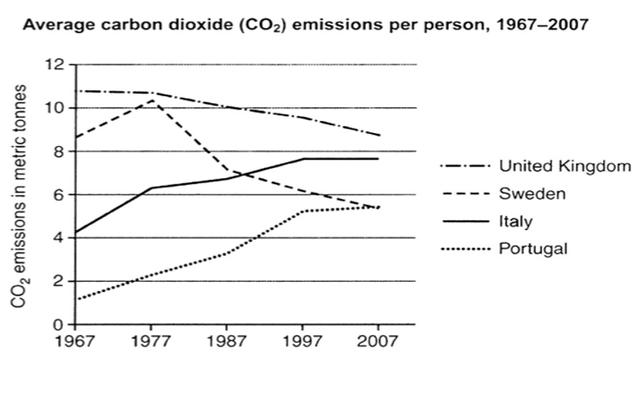
The line graph illustrates the average
carbon
footprint of residents in four Use synonyms
Europian
countries between 1967 and 2007.
Correct your spelling
European
Overall
, it is Linking Words
evidents
that Correct your spelling
evident
evidence
citizens
of Portugal and Italy increased their average Correct article usage
the citizens
carbon
dioxide Use synonyms
emmissions
from the beginning of Correct your spelling
emissions
the
1967 until the end of 2007 and Swedish and British settlers decreased their Change the article
apply
carbon
Use synonyms
emmisions
in the mentioned period.
Correct your spelling
emissions
First,
Linking Words
according to
the graph, Portuguese households' average Linking Words
carbon
Use synonyms
emmisions
per person Correct your spelling
emissions
climed
gradually from Correct your spelling
climbed
claimed
the
mid 1967 to 1997 Change the article
apply
reached
its peak of 5.5 metric Correct word choice
and reached
tonnes
, Use synonyms
then
, it showed a negligible rise by the end of 2007. Linking Words
Furthermore
, Linking Words
Italians
Change noun form
Italians'
Italian's
carbon
footprints were 4.2 metric Use synonyms
tonnes
in 1967 and Use synonyms
this
Linking Words
gigure
rose slightly by 1997 as well. Correct your spelling
figure
However
, Linking Words
this
number remained Linking Words
steadily
until 2007.
Change the word
steady
On the other hand
, Sweden and UK inhabitants were the Linking Words
contries
which displayed Correct your spelling
countries
an
reduction in the amount of Change the article
a
carbon
emissions during 40 years. British houseowners' average Use synonyms
carbon
footprint Use synonyms
were
10.5 metric Change the verb form
was
tonnes
and decreasedUse synonyms
2
levels and reached Change preposition
by 2
to
8.5. Ultimately, Change preposition
apply
co2
emissions of households in Sweden jumped to 10.4 in 1977 but displayed a sharp decrease to a mere 5 metric Correct your spelling
CO2
tonnes
by 2007.Use synonyms