The pie chart below shows the frequency of U.S. Adults’ online purchasing habits in 2015, while the bar chart shows a further classification denoting online purchasing preferences. Summarise the data by selecting and reporting the main features and make comparisons where relevant.

The pie chart below shows the frequency of U.S. Adults’ online purchasing habits in 2015, while the bar chart shows a further classification denoting online purchasing preferences. Summarise the data by selecting and reporting the main features and make comparisons where relevant.
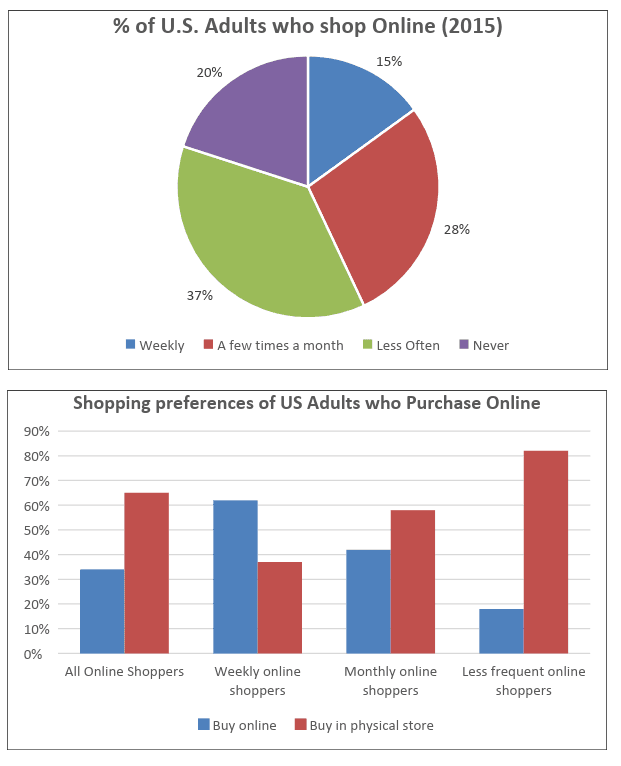
The two graphs above illustrate figures about American adults’ online purchasing
behavior
Change the spelling
behaviour
show examples
in 2015 and some details on preferences for shopping online. The first
chart
is a pie
chart
and it depicts the frequency who buying online with the following options: weekly, a few times a month, less often, and never. The second one is a bar
chart
that shows habits comparing who buys online and who buys in physical stores.
According to
the first graph, the majority who buy online buy a few times a month or less often. The group that buys weekly (20%) is almost the same percentage as the cluster that never buys online (15%). By the second
chart
, it is possible to identify that the highest difference between those who buy online and those who buy in presential shops is in that group where
are
Correct pronoun usage
there are
show examples
less frequent online shoppers.
Overall
, only 15% of citizens from The United States buy online weekly. In general, in 2015,
Americans
Replace the word
American
show examples
adults were much more likely to consume products from local stores than online. Even among the more frequent online customers, almost 40% prefer to buy in physical retail. In all groups, the clients prefer buying in local shops, except in the class where people buy more frequently.
Submitted by fmulato on

Unauthorized use and/or duplication of this material without express and written permission from this site’s author and/or owner is strictly prohibited. Excerpts and links may be used, provided that full and clear credit is given to Writing9 with appropriate and specific direction to the original content.

Sentences: Add more complex sentences.
Conclusion: The conclusion is too long.
Vocabulary: Rephrase your introduction. Words match: 75%.
Vocabulary: Replace the words chart with synonyms.
Vocabulary: The word "chart" was used 4 times.
Vocabulary: The word "graphs" was used 2 times.
Vocabulary: The word "almost" was used 2 times.
Topic Vocabulary:
  • pie chart
  • bar chart
  • online purchasing habits
  • frequency
  • classification
  • summarise
  • main features
  • comparisons
  • demographics
  • consumer trends
  • e-commerce
  • data interpretation
  • purchasing categories
  • fiscal analysis
  • technological influence
What to do next:
Look at other essays: