
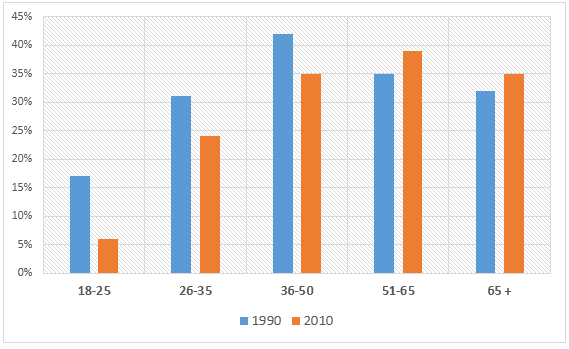
The bar graph illustrates the proportion of British
people
from different age groups donating money to charities between 1990 and 2010. Use synonyms
Overall
, the population between 36-50 and 51-65 contributed the most significant amount of money to charities. Individuals who were between 18 and 25 Linking Words
years
old donated the lowest fractions in both Use synonyms
years
.
In 1990, the proportion of Use synonyms
people
aged between 36 and 50 Use synonyms
years
old was just above 40%, Use synonyms
this
ratio followed by the 51-65 Linking Words
years
old Use synonyms
group
and the 65 Use synonyms
years
old and older Use synonyms
group
with 35 and around 32% respectively. Use synonyms
People
between 26 and 35 Use synonyms
years
old Use synonyms
was
just above 30% and the youngest Correct subject-verb agreement
were
group
of 18-25 Use synonyms
years
old was roughly 17%.
After two decades, the proportion of Use synonyms
people
Use synonyms
ranged
51-65 Wrong verb form
ranging
years
old replaced its 36-50 Use synonyms
years
old counterpart as the most dominant population donating money to charity with just under 40%. The Use synonyms
group
of Use synonyms
people
between 18-25 Use synonyms
years
old saw the most dramatic drop of around 10% over the 20 Use synonyms
years
.Use synonyms