The three pie charts show different accommodation choices by holidaymakers in the three years 1965, 1985 and 2005. Summarise the information by selecting and reporting the main features and making relevant comparisons.

The three pie charts show different accommodation choices by holidaymakers in the three years 1965, 1985 and 2005. 

Summarise the information by selecting and reporting the main features and making relevant comparisons.
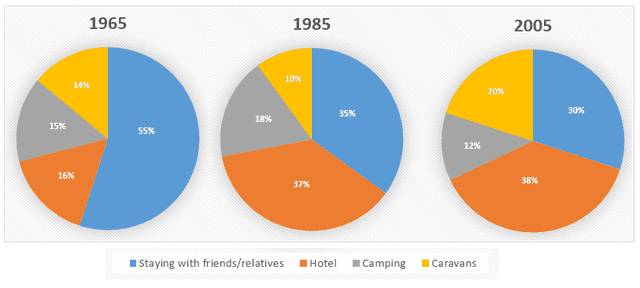
The given pie charts showcase the preferences of holidaymakers in their accommodation in three different years, decades apart from each other.
Overall
, the majority of people preferred staying in the hotels in the years 1985 and 2005 as compared to 1965, where the majority preferred staying with their friends and relatives. The majority of holidaymakers chose to stay with their
kins
Fix the agreement mistake
kin
show examples
in 1965 with 55% of the total.
However
, the number kept decreasing with 35% in 1985 and 30% in 2005. Clearly, hotels got a primary shift of interest continuously with 16% in 1965 to 37% in 1985 and
finally
, to 38% in 2005. Camping and caravans saw a zigzag in the pattern as far as the
preference
Fix the agreement mistake
preferences
show examples
of the holidaymakers
is
Correct subject-verb agreement
are
show examples
concerned. With 15% to 18% to 12% in camping and 14% to 10% to 20% in caravans in the years 1965, 1975 and 1985 respectively, the choices kept on swerving.
Submitted by zavkidm on

Unauthorized use and/or duplication of this material without express and written permission from this site’s author and/or owner is strictly prohibited. Excerpts and links may be used, provided that full and clear credit is given to Writing9 with appropriate and specific direction to the original content.

Introduction: The introduction is missing.
Introduction: The chart intro is missing.
Basic structure: Change the fourth paragraph.
Introduction: The chart intro is missing.
Vocabulary: Rephrase your introduction. Words match: 78%.
Vocabulary: Only 4 basic words for charts were used.
Vocabulary: Use several vocabularies to present the data in the fourth paragraph.
What to do next:
Look at other essays: