
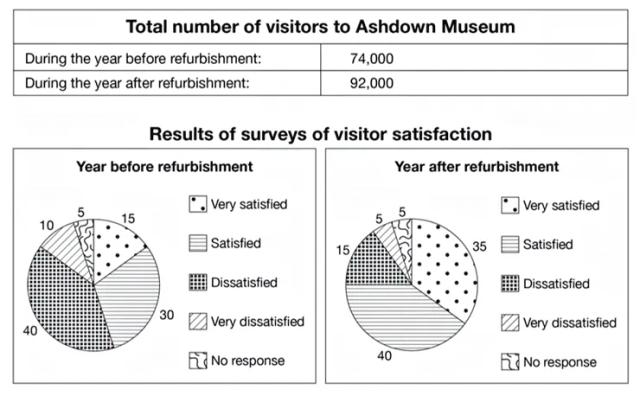
The presented
pie
charts delineate the changes in the proportion of callers in the Ashodown Museum Use synonyms
while
the table shows the numbers of callers after and before the innovation.
At first glance, we analyse that clearly the satisfied dominate every Linking Words
pie
chart with the highest rates.
Use synonyms
On the other hand
, percentages of no responses remained stable and it was Linking Words
this
rate that made their positions the lowest in both Linking Words
pie
charts. When we look at all titles, as numbers of visitors increase ,it can be clearly seen that the innovations have been effective in the museum.
It is explicitly observed that changes in very satisfied and dissatisfied are quite different. In the first Use synonyms
pie
chart , very satisfied had the third highest percentage with fifteen in every hundred Use synonyms
while
the Linking Words
dissatisfed
preserved forty travellers in every hundred, Correct your spelling
dissatisfied
however
, after the following year, satisfied caught a downward tendency ( from %30 %to 40) . Linking Words
Likewise
, Linking Words
dissatisfied's
rates went down abruptly (from %40 % to 15) . Replace the word
dissatisfaction
Therefore
, no response and very Linking Words
dissatisfied
intersected at the identical proportion ( five in every one hundred). Replace the word
dissatisfaction
Furthermore
, very dissatisfied never dominated the charts because , before the changes, it had only one-tenth .
Linking Words
Overall
, Rises were satisfied and very satisfied Linking Words
in contrast
to dramatic decreases of very-dissatisfied and dissatisfied.Linking Words