
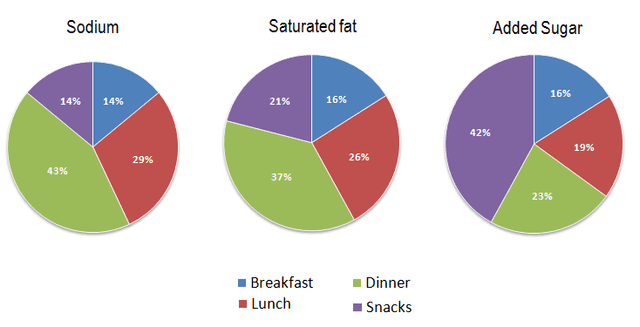
The pie chart illustrates the proportion of Sodium, Saturated fats, and Added sugar in an average meal in the USA.
After analysis, it can be seen clearly that, Sodium is the main unhealthy ingredient in people's supper with 42% of the portion followed by 37% harmful fats and 23% destructive sweeteners. on the other side, 16% of a people's morning menu contains unhealthy fats, the same refers to sugar and there is only 14% salt.
Secondly
, The biggest amount of nutrient Linking Words
that is
not healthy in snacks is sweetener with 42% followed by 14% and 21% grease and salt, respectively. Lunches contain between 20% and 30% of every harmful ingredient with the largest proportion of sodium for that time of the day at 21%.
Linking Words
Overall
, it can be seen that dinner is the meal that contains most of the unhealthy nutrients, Linking Words
in contrast
with breakfast, which is the most healthy meal for the day.Linking Words