
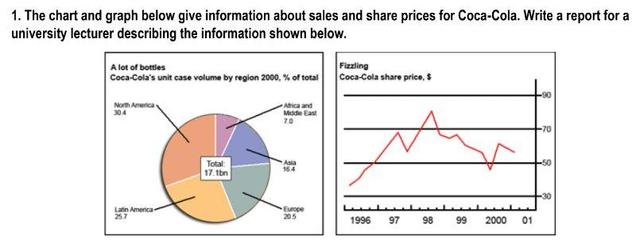
The chart and graph illustrate data about global
sales
and Use synonyms
share
prices for Use synonyms
Coca-Cola
in a 5-year period between 1996 and 2001.
Use synonyms
It is clear that
people in North America consumed Linking Words
Coca-Cola
more than any other region in the world in 2000, Use synonyms
while
it was least popular in Africa and the Middle East. Linking Words
Also
, Linking Words
Coca-Cola
's Use synonyms
share
price experienced a rise during the period shown in question.
In 1996, the Use synonyms
share
price of Use synonyms
Coca-Cola
was just under 40$. After that, the figure increased sharply in the coming year, reaching just under 70 dollars. Use synonyms
Following
Linking Words
this
, it dipped slightly and Linking Words
then
recovered until hitting a peak at approximately 80$, which meant that it achieved the highest level of Linking Words
share
prices during the whole period. Use synonyms
Then
, it decreased steadily by almost 35$ in 2000, after which it went up to just over 55$ in 2001.
In 2000, 17.1bn bottles of Linking Words
Coca-Cola
were sold. The Use synonyms
sales
percentage of Use synonyms
Coca-Cola
are varied in each region all over the world. Use synonyms
Sales
in North America were the most popular at just under one-third of the total units, just ahead of Latin America at 25.7 per cent. Europe came next with 20.5% of total Use synonyms
sales
of Use synonyms
Coca-Cola
, making it more popular than that in Asia at 16.4%, Use synonyms
although
that was over twice as many as in Africa and the Middle East.Linking Words