
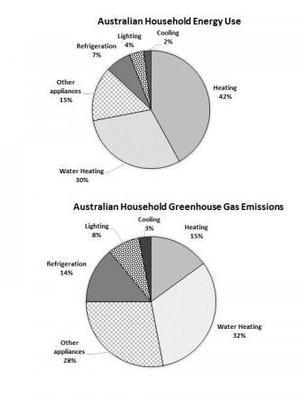
The early chart depicts how Australia consumes average
energy
. The Use synonyms
further
chart illustrates the Linking Words
gas
Use synonyms
emission
effect of the greenhouse as the result of that Use synonyms
energy
use.
Use synonyms
Overall
, in the beginning, most Linking Words
energy
was used for heating purposes. Use synonyms
While
water heating produces the most greenhouse Linking Words
gas
emissions. Use synonyms
Whereas
, in both cooling is less involved.
In the beginning, Australian families used 42% Linking Words
energy
for heating purposes which is the highest Use synonyms
energy
Use synonyms
that is
used. Linking Words
Further
, they are using 30% Linking Words
energy
for water heating which is 2nd highest. After that, they consume 7% of Use synonyms
energy
for refrigeration or 15% of Use synonyms
energy
consumed for other appliances. Use synonyms
Lastly
, they are using 4 % Linking Words
energy
for lighting and 2% for cooling which is the lowest Use synonyms
ratio
.
Use synonyms
Additionally
, the heating produces 15% Linking Words
gas
emissions. Use synonyms
While
water heating generates 32% of Linking Words
gas
emissions. Use synonyms
This
is the highest Linking Words
ratio
of Use synonyms
gas
Use synonyms
emission
crop. Use synonyms
In addition
, the refrigeration outcomes of 14% gass Linking Words
emission
and other appliances produce 28% gass Use synonyms
emission
which is the 2nd highest Use synonyms
ratio
. In conclusion, lighting generates 8% Use synonyms
gas
Use synonyms
emission
and cooling produces 3% Use synonyms
gas
Use synonyms
emission
which is the lowest Use synonyms
ratio
.Use synonyms