
The graph indicates how much money was spent on buying four different types of
games
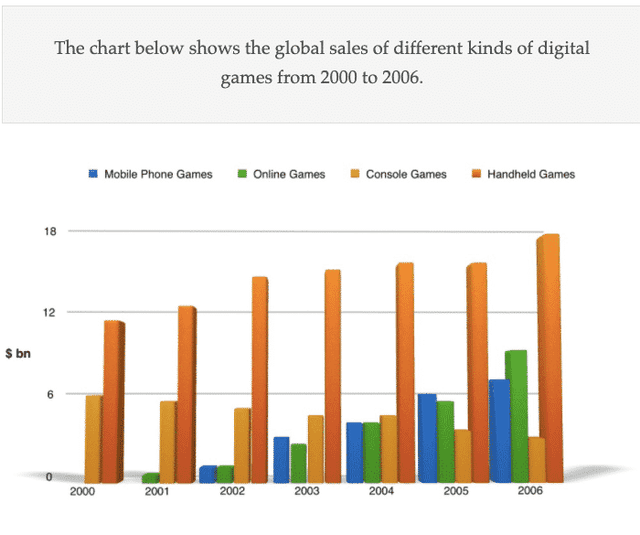
all around the world during a six-year interval.
Use synonyms
Overall
, it is explicit that handheld Linking Words
games
have been the most popular ones within the period; Use synonyms
also
, online Linking Words
games
have gained a reputation during the Use synonyms
last
years.
Focusing on console and handheld Linking Words
games
, what stands out from the scheme is that at Use synonyms
first,
these two were the only available types. In more detail, in the first year of investigation six Linking Words
billions
Fix the agreement mistake
billion
of
dollars were spent on console Change preposition
apply
games
; Use synonyms
while
it was double for handheld. Linking Words
Moreover
, Linking Words
whereas
console Linking Words
games
followed a downward trend to decline to nearly three billion sales in 2006; handheld Use synonyms
games
started to earn more popularity to a peak of 18 million in the same year.
Returning to mobile and online Use synonyms
games
, it can be seen that with a minor difference, the latter had more fans in comparison with the former; Use synonyms
although
the sales figure for mobile Linking Words
games
was a bit more than online Use synonyms
games
’ until 2005, the information on online Use synonyms
games
took over of its opponent in 2006 to reach approximately 9 million in the final stage.Use synonyms