
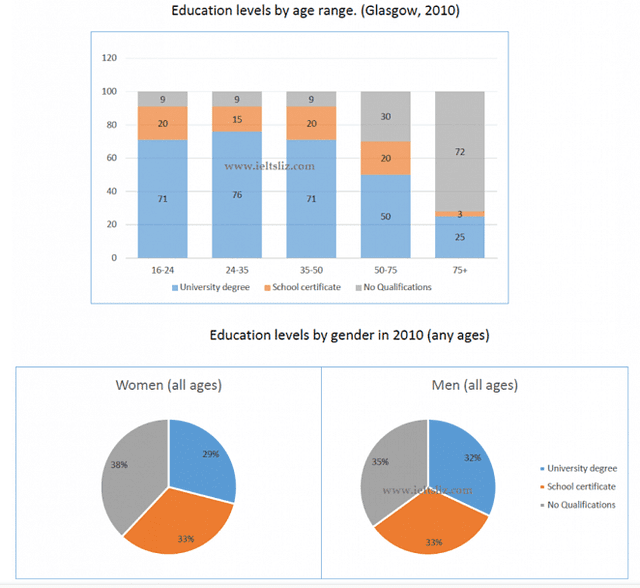
The charts indicate five aged-groups female and male citizens of three educational levels in Glasgow in 2010.
Overall
, the bar Linking Words
chart
depicts the highest Use synonyms
percentage
of 24-35 ages of respondents who studied university degree, Use synonyms
whereas
75 or above was the lowest Linking Words
percentage
with no qualifications. Use synonyms
However
, the pie Linking Words
chart
reports the highest Use synonyms
proportion
of men who studied at universities, Use synonyms
while
the lowest Linking Words
proportion
of women who joined post-secondary educational institutions.
Use synonyms
To begin
with, from the bar Linking Words
chart
, the largest Use synonyms
percentage
of those 24-35 ages of respondents who learned from universities, at 76%, Use synonyms
whereas
the 75 or above ages of the lowest Linking Words
percentage
, who did not have any qualifications, at 72%, it was less than 4% the largest one in 2010.
Use synonyms
On the other hand
, the pie Linking Words
chart
reports the highest Use synonyms
proportion
of men who studied at universities, at 32%, Use synonyms
while
the lowest Linking Words
proportion
of women who joined post-secondary educational institutions, at 29%, women were less just only 3% than highest one in the same year.Use synonyms