
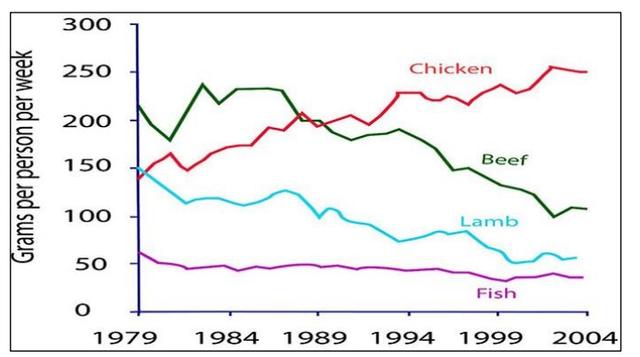
The presented line graph demonstrates the differences in the utilisation of fish and other kinds of
meat
in a country which is located in Europe over the next 15 years from 1979 and 2004.
A glance at the line graph makes it clear that using chicken Use synonyms
meat
made up more popular than others and utilizing fish products stayed at the same level, meanwhile consuming beef and lamb Use synonyms
meat
saw a slight drop.
Use synonyms
Initially
,as is presented in the diagram beef Linking Words
meat
was widely used at the beginning of the period which was replaced by chicken.It began with 200 grams per person per week in the first year after which fluctuated slightly and dropped to 100.Lamb Use synonyms
meat
saw a slight fall.
Regarding fish products,it is clearly seen that they remained unchanged which started with just over 50gr and Use synonyms
then
levelled at 50gr.Chicken sales saw a dramatic increase, accounting for 250 grams per person by 2000 years.Linking Words