
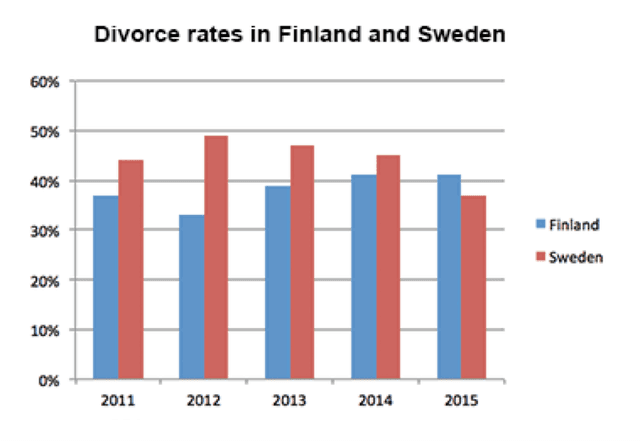
The graph delineates the percentage of
Divorce
rates in Finland and Sweden in the years Use synonyms
of
2011 to 2015. By and large, the proportion of it in Finland experienced an upward trend Change preposition
apply
while
in Sweden witnessed the opposite.
Linking Words
Initially
, in 2011, the percentage of Linking Words
divorce
in Finland was Use synonyms
at
below 40%, and it declined at approximately 33%. Change preposition
apply
However
, it started to rise, gradually , until reaching a peak of almost 41% in 2014. Meanwhile, Linking Words
at the end
of the period given (2015), the percentage of Linking Words
divorce
remained unchanged Use synonyms
with
the year before.
In terms of Sweden, Change preposition
from
in
the beginning of the period, the Change the preposition
at
rates
of Fix the agreement mistake
rate
divorce
in 2011 was Use synonyms
at
above 40%, and it rose until picking at just below 50% in 2012. Meanwhile, in 2013 the rates showed a decrease which in 40% of Change preposition
apply
divorce
cases had been found, and it reduced respectively until leveling Use synonyms
of
at around Change preposition
apply
at
37% 2015.Change preposition
apply