
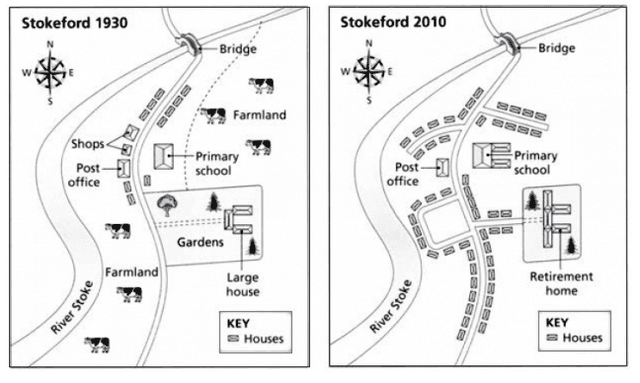
The presented flow chart delineates how Stokeford Village changed over a period of 8 decades between 1930 and 2010.
Overall
, it is evident that the village of Stokeford witnessed a striking transformation. The most tangible change is the moderate increase in the figure for housesLinking Words
,
and the addition of multiple facilities.
Remove the comma
apply
Initially
, as illustrated by the graph, the post office was positioned opposite the river and a primary school. After 80 years, both the office and the school remained stable. Linking Words
Next,
the most conspicuous modernization is that all farmland was demolished to make place for residents’ households. Linking Words
In addition
, many roads were constructed, and different houses were erected around these roads.
Another Linking Words
elements
to concern is that the bridge, which crosses the River Stoke, was still unchanged after eight decades. Replace the adjective
element
Last
but not least, the area which included a large house and gardens was minimized. Linking Words
Furthermore
, the large house, which is located amidst the garden, was expanded to make a place for the retirement house.Linking Words