
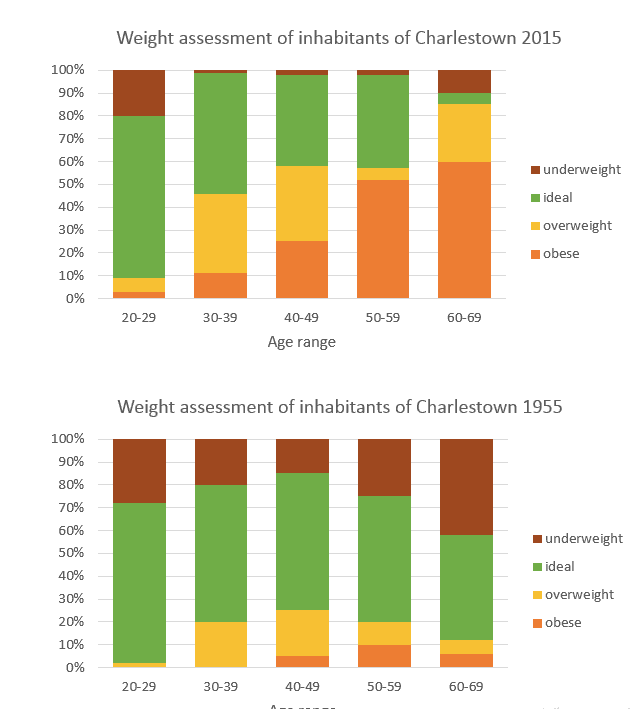
The chart compares the weight of inhabitants in Charlestown in the years 1955 and 2015.
Overall
, in 2015, the number of obese Linking Words
people
had an increasing tendency, Use synonyms
whereas
in the past, the least amount of individuals were overweight. Linking Words
Additionally
, it was more consistent to have an ideal weight over the years in 1955 rather than in 2015.
Linking Words
To begin
, in 1955, the biggest proportion of inhabitants were in ideal body shape, starting from 70% in the 20 to 29 Linking Words
aged
group, finilising in about 50% of those who are 60 to 69 years old. Replace the word
age
Furhermore
, the number of Correct your spelling
Furthermore
people
who faced obesity fluctuated from 5% for those who are 40 to 49, to 10% (50 to 59) and Use synonyms
then
moved back to 5% (60-69), accounting for the lowest proportions in the chart.
Looking at the modern statistics, the percentage of obese inhabitants had significantly grown from around 1% for youngstersLinking Words
,
to 60% for elders. Remove the comma
apply
Moreover
, it was quite common for young Linking Words
people
to have an ideal weight, Use synonyms
while
only 5% of elders aged 60 to 69 were in a healthy form. Even thoughLinking Words
,
being in ideal condition was quite popular in the past, there was a significant number of Remove the comma
apply
people
who suffered from underweight.Use synonyms