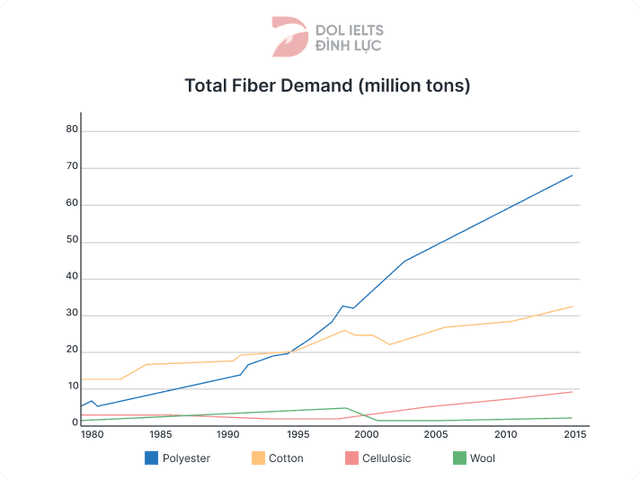
The given line graph compares the global demand for four different types of textiles over a period of 35 years between 1980 and 2015. Unit are measured in millions
Change preposition
of ton
show examples
ton
Fix the agreement mistake
tons
show examples
.
Deddymus
Unauthorized use and/or duplication of this material without express and written permission from this site's author and/or owner is strictly prohibited. Excerpts and links may be used, provided that full and clear credit is given to Writing9 with appropriate and specific direction to the original content.
Linking words: Add some linking words.
▼
Linking words: Add linking words.
▼
Basic structure: Write more paragraphs.
▼
Basic structure: Add more body paragraphs.
▼
Common mistake: Your writing should be 150-250 words.
Basic structure: Write more paragraphs.
▼
Vocabulary: Rephrase your introduction. Words match: 67%.
▼
Vocabulary: Rephrase the word "undefined" in your introduction.
▼
Vocabulary: Only 3 basic words for charts were used.
As traffic and housing problems in urban life keep on the rise. It is debatable that the main cause is the large companies and factories that are spiking the volume of this issue, but if that is really the issue, replacing them would cause a shortage in the employment rate and other damages to the economy.
I am writing to request a reduction in my working hours so that I can pursue part-time studies in business management. This course will help me improve my professional skills and contribute more effectively to the company.
Since the beginning of humanity, many different foreign languages are spoken by humans. Language is the most important thing that can make people communicate. Therefore, various languages existed while the civilizations were developing. Unfortunately, many of them died out through the years. Some people think that it is not considered because differentiation makes our lives harder. In my opinion, it is important to provide any language spoken because it helps us to know human history.
I am writing a letter to apply to an entrepreneur. 1 month ago I was training in cooking while traveling. There were also those who wanted to improve their skills at the meetings there. At that time I was sitting next to you at one of the tables and we talked with you. You said this is my biggest restaurant and you said you have other restaurants. Let me remind you that you mentioned that I could work in your restaurant in the profession that I am improving my skills.