
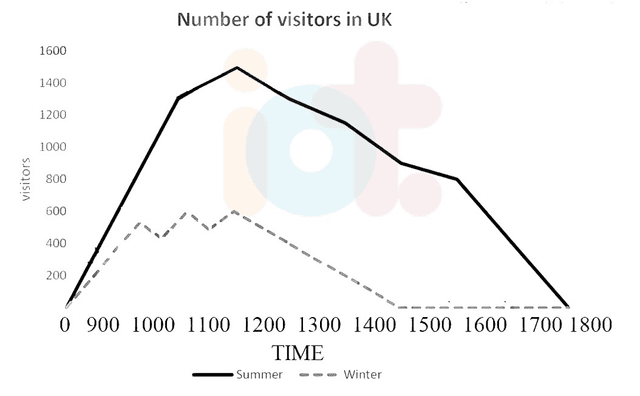
The line graph illustrates the data on the average number of tourists who visited a museum in summer and
winter
in the year 2003.
Use synonyms
Overall
, there are major differences in warm weather and wintertime guest appearance in the museum, At a glance majority of visitors were in summer, Linking Words
while
the minority were in Linking Words
winter
.
Use synonyms
To begin
with, the number of travellers starts both in summer and Linking Words
winter
from zero, Use synonyms
then
in warm weather and cold season, sightseers climbed gradually to 800 and 550 Linking Words
in
1000 times respectively. Change preposition
apply
Then
visitors in Linking Words
winter
are approx stabilized till 1150 afterwards graph dropped again to zero at time 1450 and its remain continue till 1800.
Use synonyms
On the other hand
, the hot weather line is increased sharply for travellers and its makes hike at 1150Linking Words
,
Remove the comma
apply
after
Linking Words
this
line is used to slumped and starts declined, after at time 1550 rush is dropped and at 1800 visitors have become nill.Linking Words