
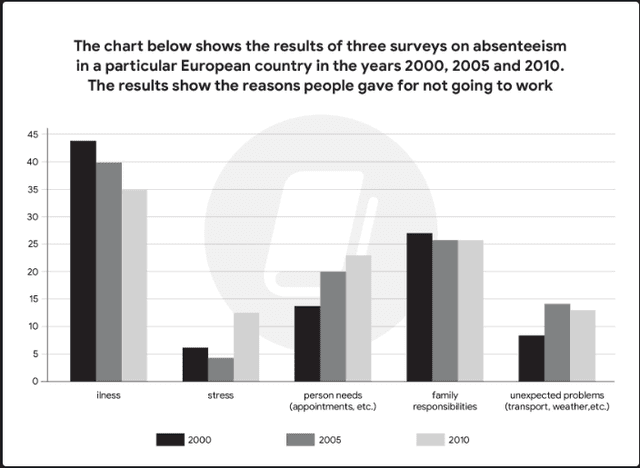
The bar chart illustrates the percentage of five reasons for
people
absenting Use synonyms
at
Change preposition
from
work
in Use synonyms
a
mentioned country of Europe from 2000 to 2010.
Correct article usage
the
Overall
, it could be seen that illness and family duties were the main reasons for absenteeism, Linking Words
while
the opposite was true in the bar of stress. Linking Words
Moreover
, there were upward trends in the portions of Linking Words
people
not going to Use synonyms
work
Use synonyms
due to
stress, personal needs and unexpected problems.
Linking Words
To begin
with, there were nearly 45% of Linking Words
people
not going to Use synonyms
work
because of illness, which was the highest percentage in the chart, Use synonyms
however
declining by around 10% after 10 years. A similar trend could be seen in the second rank of percentages of individuals Linking Words
absenting
from the workplace for family responsibilities. In detail, Replace the word
absent
this
percentage started at over 25%, Linking Words
then
slightly decreased to 25% in the year 2005 and 2000.
Looking at the rest, the third rank of the reason why Linking Words
people
were not at Use synonyms
work
was because of personal needs, contributing under 15% in the first year of the period, Use synonyms
then
soaring by 10% in 2010. Stress, meanwhile, experienced a low growth, from roughly 5% to over 10% in 10 years. Linking Words
Finally
, an increase was witnessed in the figure for unexpected issues Linking Words
such
as transport or weather beginning at the level of around 10%, Linking Words
then
peaking at close to 15% before falling down Linking Words
at the end
of the period.Linking Words