
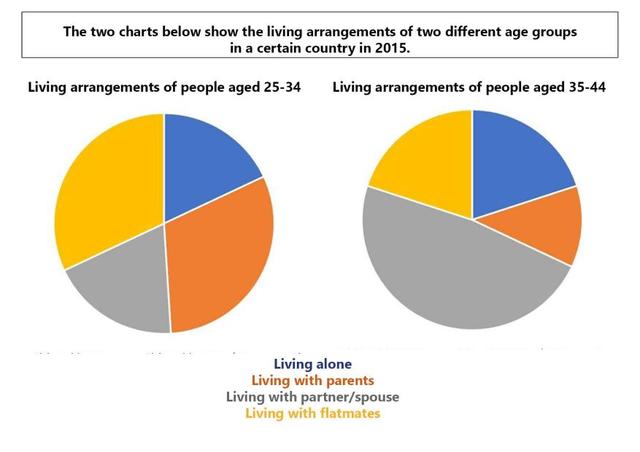
The given pie charts illustrate how people of different groups of
age
choose to live in a particular country in the year 2015.
Use synonyms
Overall
, types of living with Linking Words
parents
and flatmates account for the biggest Use synonyms
of
total in Change preposition
apply
Use synonyms
age
25-34. For the 35-44 Fix the agreement mistake
ages
age
group, living with a partner or spouse is the largest for others and living with Use synonyms
parents
is the lowest.
Use synonyms
Firstly
, for the 25-34 Linking Words
age
group, living with Use synonyms
parents
and flatmates share the same at about 35% each. Following Use synonyms
that is
living alone and a partner accounts for a quarter of the total. Next is 35-44 Linking Words
age
, most people Use synonyms
also
have a family so living with a spouse is the most popular, nearly a half of the total. After that, living with Linking Words
parents
and alone occupy around 20%. And the Use synonyms
last
one living with roommates is the smallest in Linking Words
this
Linking Words
age
group, which is just about 15% of the total.Use synonyms