
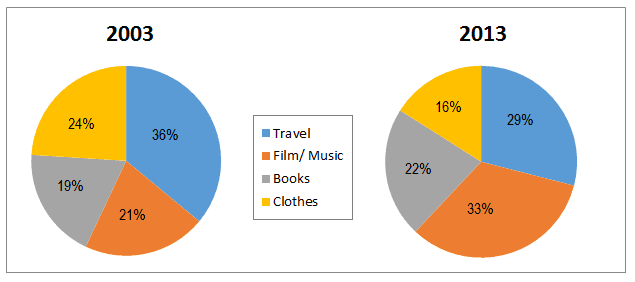
The pie chart illustrates the marketing of mail orders for the sales division from 2003 to 2013 in New Zealand.
Overall
, as can be seen, travel accounted for the highest sales in 2003 Linking Words
while
film and music took over the place which aimed for the most popular trade. Two divisions (travel and clothes) have a similar pattern as they rose in the trend whilst the remaining categories declined in a decade.
In 2003, there were a number of people who liked to spend their money on travelling through online shopping at 36% Linking Words
although
the lowes came from books. The subsequent categories showed the percentages in the middle of interest which counted at 24% and 21% (clothes, film and music, respectively.
In 2013, all of the elements indicated a change. The lowest category in the past period increased dramatically to 33% (film and music) Linking Words
whereas
book sales grew around 22%. Linking Words
In contrast
, travel spent 29% which fell from the Linking Words
last
decade Linking Words
as well as
clothes with just about 16%.Linking Words